. 2017 Feb 14;8(1):e02340-16.
doi: 10.1128/mBio.02340-16.

FANCD2 Binds Human Papillomavirus Genomes and Associates with a Distinct Set of DNA Repair Proteins to Regulate Viral Replication

Affiliations

FANCD2 Binds Human Papillomavirus Genomes and Associates with a Distinct Set of DNA Repair Proteins to Regulate Viral Replication

Chelsey C Spriggs et al. mBio. .

Abstract

The life cycle of human papillomavirus (HPV) is dependent on the differentiation state of its host cell. HPV genomes are maintained as low-copy episomes in basal epithelial cells and amplified to thousands of copies per cell in differentiated layers. Replication of high-risk HPVs requires the activation of the ataxia telangiectasia-mutated (ATM) and ATM and Rad3-related (ATR) DNA repair pathways. The Fanconi anemia (FA) pathway is a part of the DNA damage response and mediates cross talk between the ATM and ATR pathways. Our studies show that HPV activates the FA pathway, leading to the accumulation of a key regulatory protein, FANCD2, in large nuclear foci. These HPV-dependent foci colocalize with a distinct population of DNA repair proteins, including ATM components γH2AX and BRCA1, but infrequently with p-SMC1, which is required for viral genome amplification in differentiated cells. Furthermore, FANCD2 is found at viral replication foci, where it is preferentially recruited to viral genomes compared to cellular chromosomes and is required for maintenance of HPV episomes in undifferentiated cells. These findings identify FANCD2 as an important regulator of HPV replication and provide insight into the role of the DNA damage response in the differentiation-dependent life cycle of HPV.IMPORTANCE High-risk human papillomaviruses (HPVs) are the etiological agents of cervical cancer and are linked to the development of many other anogenital and oropharyngeal cancers. Identification of host cellular pathways involved in regulating the viral life cycle may be helpful in identifying treatments for HPV lesions. Mutations in genes of the Fanconi anemia (FA) DNA repair pathway lead to genomic instability in patients and a predisposition to HPV-associated malignancies. Our studies demonstrate that FA pathway component FANCD2 is recruited to HPV DNA, associates with members of the ATM DNA repair pathway, and is essential for the maintenance of viral episomes in basal epithelial cells. Disruption of the FA pathway may result in increased integration events and a higher incidence of HPV-related cancer. Our study identifies new links between HPV and the FA pathway that may help to identify new therapeutic targets for the treatment of existing HPV infections and cancers.


Figures

FIG 1
FIG 1
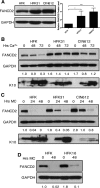
Levels of FANCD2 are increased in HPV-positive cells and remain elevated through differentiation. (A) Western blot analysis of FANCD2 levels in normal human foreskin keratinocytes (HFKs), HFKs stably transfected with HPV31 whole genomic DNA (HFK31), and CIN612 cells. The graph demonstrates FANCD2 protein levels relative to GAPDH and normalized to FANCD2 levels in HFKs across three independent experiments. Error bars represent standard deviations between experiments. A standard Student’s t test was used to determine statistical significance. *, P ≤ 0.05; ***, P ≤ 0.001. (B) Western blot analysis of FANCD2 levels in HFK, HFK31, and CIN612 cells that were differentiated in 1.5 mM calcium medium for 48 or 72 h. Epithelial differentiation was confirmed by levels of cytokeratin 10. (C) Western blot analysis of FANCD2 levels in HFK, HFK31, and CIN612 cells that were differentiated in 1.5% methylcellulose for 24 or 48 h. Epithelial differentiation was confirmed by levels of cytokeratin 10. (D) Western blot analysis of FANCD2 levels in HFK and HFKs stably transfected with HPV16 DNA that were differentiated for 48 h in 1.5% methylcellulose. Quantification of FANCD2 band intensity was determined by densitometry using Image Lab software relative to GAPDH and normalized to HFKs.
FIG 2
FIG 2
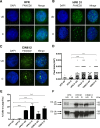
HPV infection leads to FA pathway activation. (A to C) Immunofluorescence analysis of FANCD2 localization in HFK, HFK31, and CIN612 cells that were differentiated for 72 h in 1.5 mM calcium medium. Cells were stained with anti-FANCD2 (green) and counterstained with DAPI (blue). UD, undifferentiated; D, differentiated. (D) ImageJ software was used to quantitate focus size by automated particle analysis. The graph represents the size of individual foci represented in pixel units (AU2). Error bars represent the standard errors of the means within the sample. A standard Student’s t test was used to determine statistical significance. ***, P ≤ 0.0005; ****, P ≤ 0.0001. Differences in focus size between undifferentiated cell populations were not statistically significant. (E) The graph demonstrates the percentage of cells with large, nuclear FANCD2 foci. Error bars represent the standard deviations between experiments. A standard Student’s t test was used to determine statistical significance. *, P ≤ 0.05; ***, P ≤ 0.0005; ****, P ≤ 0.0001. (F) Western blot analysis of FANCD2-Ub (D2-Ub) in HFK, HFK31, and CIN612 cells that were differentiated for 72 h in 1.5 mM calcium medium (top). A longer exposure shows that FANCD2-Ub is undetectable in differentiated HFK samples (bottom).
FIG 3
FIG 3
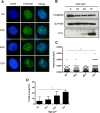
FA pathway activation further increases as differentiation progresses in HPV-positive cells. (A) Immunofluorescence analysis of FANCD2 localization in CIN612 cells that were differentiated in 1.5 mM calcium for 24, 48, or 72 h. Cells were stained with anti-FANCD2 (green) and counterstained with DAPI (blue). (B) Western blot analysis of FANCD2 levels in CIN612 cells that were differentiated in high-calcium medium for 24, 48, or 72 h. GAPDH was used as a loading control. Epithelial differentiation was confirmed by levels of cytokeratin 10. (C) ImageJ software was used to quantitate focus size by an automated particle analysis program. The graph represents individual focus size represented in pixel units (AU2). Error bars represent the standard error mean within the sample. A standard Student’s t test was used to determine statistical significance. **, P ≤ 0.005. (D) The graph demonstrates the percentage of cells with large nuclear FANCD2 foci. Error bars represent the standard deviations between experiments. A standard Student’s t test was used to determine statistical significance. **, P ≤ 0.005.
FIG 4
FIG 4
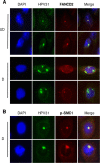
FANCD2 colocalizes with components of the ATM pathway in discrete nuclear foci. (A) HFKs and CIN612 cells were differentiated for 72 h in 1.5 mM calcium medium. Western blot analysis was performed using antibodies to FANCD2, FANCI, BRCA1, BRCA2, RAD51, and γH2AX. GAPDH was used as a loading control. (B and C) CIN612 cells were differentiated for 72 h in 1.5 mM calcium medium and stained with anti-FANCD2 (green) and either anti-BRCA1, anti-γH2AX, or anti-p-SMC1 (red). Cells were counterstained with DAPI (blue). UD, undifferentiated; D, differentiated.
FIG 5
FIG 5
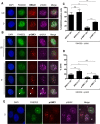
Distinct populations of foci exist during HPV infection. (A and B) CIN612 cells were differentiated for 72 h in 1.5 mM calcium medium. Immunofluorescence analysis was performed on cells stained with anti-FANCD2 (green) and either anti-BRCA1 or anti-p-SMC1 (red). Cells were then counterstained with anti-γH2AX (pink) and DAPI (blue). Arrows indicate foci where FANCD2, γH2AX, and p-SMC1 are found together. UD, undifferentiated; D, differentiated. (C) The graph demonstrates the percentage of cells with FANCD2 foci where at least one focus colocalizes with γH2AX and either BRCA1 or p-SMC1. (D) The graph represents the percentage of all HPV-positive cells where at least one FANCD2 focus colocalizes with γH2AX and either BRCA1 or p-SMC1. Error bars represent the standard deviations between experiments. A standard Student’s t test was used to determine statistical significance. *, P ≤ 0.05; **, P ≤ 0.01; ***, P ≤ 0.001. ns, not significant. (E) Representative image of three distinct populations in differentiated CIN612 cells stained with anti-FANCD2 (green), anti-p-SMC1 (red), anti-γH2AX (pink), and DAPI (blue). Populations are identified as having FANCD2 foci with no p-SMC1 foci (i), having p-SMC1 foci with no FANCD2 foci (ii), and having both FANCD2 and p-SMC1 foci (iii).
FIG 6
FIG 6
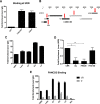
FANCD2 is preferentially recruited to HPV DNA. (A) Chromatin immunoprecipitation (ChIP) analysis of FANCD2 and γH2AX binding to the URR in CIN612 cells. Quantitative real-time PCR (qRT-PCR) was performed using a LightCycler 480 (Roche), and fold enrichment was quantitated relative to an IgG control. Similar results were seen in three independent experiments. Error bars represent the standard deviations between experiments. (B) Schematic of the HPV31 linearized genome, with primer regions indicated with arrows. (C) ChIP analysis for FANCD2 binding at indicated sites in the viral genome. Fold enrichment was normalized to an IgG control. Similar results were seen in three independent experiments. Error bars represent the standard deviations between experiments. (D) ChIP analysis of FANCD2 binding at the URR compared to Alu repeat and fragile site regions (FRA3B and FRA16D) in the host genome. Enrichment was normalized to an IgG control and is represented as fold change over URR across three independent experiments. The graph represented as percentage of input shows a similar trend (Fig. S1). Error bars represent the standard deviations between experiments. A standard Student’s t test was used to determine statistical significance. **, P < 0.005; ***, P < 0.0005. (E) CIN612 cells were differentiated for 72 h in 1.5 mM calcium medium, and ChIP analysis was performed for binding across the HPV genome. Fold enrichment was normalized to an IgG control. Similar results were seen in three independent experiments. Error bars represent the standard deviations between experiments. UD, undifferentiated; D, differentiated.
FIG 7
FIG 7
FANCD2 localizes to HPV replication centers. (A) CIN612 cells were differentiated for 72 h in 1.5 mM calcium medium. Immunofluorescence analysis for FANCD2 (red) was performed followed by fluorescent in situ hybridization (I-FISH) for HPV31 DNA (green). Cells were counterstained with DAPI (blue). In undifferentiated cells, the FANCD2 signal overlapped with 42.47% ± 12.17% of the HPV31 DNA signal and 11.55%± 1.479% in differentiated cells. UD, undifferentiated; D, differentiated. (B) CIN612 cells were differentiated in 1.5 mM calcium medium, and immunofluorescence analysis for p-SMC1 (red) was performed followed by fluorescent in situ hybridization for HPV31 DNA (green). Cells were counterstained with DAPI (blue). In differentiated cells, the p-SMC1 overlapped with 31.85% ± 8.54% of the HPV31 DNA signal. The percentage of overlap between the HPV31 DNA signal and either FANCD2 or p-SMC1 was measured using ImageJ area analysis and found to be statistically significant where P is <0.05.
FIG 8
FIG 8
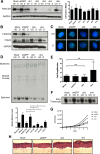
Knockdown of FANCD2 limits HPV31 replication. (A) CIN612 cells were transiently transduced with lentiviral vectors encoding five individual shRNAs against FANCD2 or GFP as a control. After 48 h, cells were differentiated in 1.5% methylcellulose for an additional 48 h. FANCD2 knockdown was assessed by Western blot analysis using GAPDH as a loading control. At 96 h posttransduction, cells were harvested and stained with trypan blue (Bio-Rad) to assess cell viability. The graph shows the total number of live cells in monolayer culture at the time of collection. Error bars represent the standard deviations between measurements. UD, undifferentiated; D, differentiated. (B) CIN612 cells transduced with shGFP or shFANCD2 were differentiated for 48 h in 1.5% methylcellulose, and Western blot analysis was used to assess FANCD2 and FANCI protein levels. GAPDH was used as a loading control. (C) Immunofluorescence analysis of control and FANCD2 knockdown cells that were differentiated for 72 h in 1.5 mM calcium medium. Cells were stained with anti-FANCD2 (green) and counterstained with DAPI (blue). (D) CIN612 cells were differentiated for 48 h in 1.5% methylcellulose, and total DNA was isolated from control and shFANCD2 cells. Viral replication was assessed by Southern blot analysis. Similar results were seen using high calcium concentrations to induce differentiation (Fig. S2). Quantification of episomal band intensity was determined by densitometry using Image Lab software and normalized to the undifferentiated shGFP-infected sample across three independent experiments. Differences in episomal levels between mock- and shGFP-infected cells were not statistically significant. Error bars represent the standard deviations between experiments. A standard Student’s t test was used to determine statistical significance. *, P ≤ 0.05. (E) The ratio of episomal DNA in undifferentiated and differentiated samples was calculated to determine fold amplification in knockdown and control cells. Error bars represent the standard deviations between experiments. ns, not significant. (F) Control and shFANCD2 cells were differentiated for 48 h in 1.5% methylcellulose. Total RNA was isolated, and early transcript expression was determined by Northern blot analysis. The Northern blot shows expression of the primary early transcript E6*E7 E1^E4 E5. (G) CIN612 cells that stably express either control or shFANCD2 were seeded at 5 × 10⁴ into each well of a 6-well cell culture dish. Cells were harvested and counted each day for 6 days or until reaching confluence. (H) H&E stain of control of shFANCD2-expressing HFK31 cells that were differentiated for 14 days in organotypic raft culture. Similar results were seen in CIN612 cells grown in raft culture.
FIG 9
FIG 9
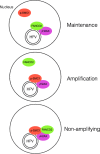
Model showing the different populations of FANCD2/γH2AX/HPV DNA and p-SMC1/ γH2AX/HPV DNA foci found in HPV-positive cells upon differentiation. p-SMC1 and FANCD2 are rarely found together in the same nuclei. The cells with p-SMC1/γH2AX bound to HPV genomes likely represent the amplifying population, while those with FANCD2/γH2AX are not amplifying.

Similar articles

Cited by

References

    1. Münger K, Howley PM. 2002. Human papillomavirus immortalization and transformation functions. Virus Res 89:213–228. doi:10.1016/S0168-1702(02)00190-9. - DOI - PubMed
    1. Münger K. 2002. The role of human papillomaviruses in human cancers. Front Biosci 7:d641–d649. doi:10.2741/A800. - DOI - PubMed
    1. Doorbar J, Quint W, Banks L, Bravo IG, Stoler M, Broker TR, Stanley MA. 2012. The biology and life-cycle of human papillomaviruses. Vaccine 30(Suppl 5):F55–F70. doi:10.1016/j.vaccine.2012.06.083. - DOI - PubMed
    1. Sakakibara N, Chen D, McBride AA. 2013. Papillomaviruses use recombination-dependent replication to vegetatively amplify their genomes in differentiated cells. PLoS Pathog 9:e1003321. doi:10.1371/journal.ppat.1003321. - DOI - PMC - PubMed
    1. Lee C, Laimins LA. 2007. The differentiation-dependent life cycle of human papillomaviruses in keratinocytes, p 45–68. In Dimaio D, Garcea D (ed), The papillomaviruses. Springer, New York, NY.

MeSH terms

LinkOut - more resources