. 2017 Feb 14:7:42041.
doi: 10.1038/srep42041.

NG2 glial cells regulate neuroimmunological responses to maintain neuronal function and survival

Affiliations

NG2 glial cells regulate neuroimmunological responses to maintain neuronal function and survival

Masayuki Nakano et al. Sci Rep. .

Abstract

NG2-expressing neural progenitor cells (i.e., NG2 glial cells) maintain their proliferative and migratory activities even in the adult mammalian central nervous system (CNS) and produce myelinating oligodendrocytes and astrocytes. Although NG2 glial cells have been observed in close proximity to neuronal cell bodies in order to receive synaptic inputs, substantive non-proliferative roles of NG2 glial cells in the adult CNS remain unclear. In the present study, we generated NG2-HSVtk transgenic rats and selectively ablated NG2 glial cells in the adult CNS. Ablation of NG2 glial cells produced defects in hippocampal neurons due to excessive neuroinflammation via activation of the interleukin-1 beta (IL-1β) pro-inflammatory pathway, resulting in hippocampal atrophy. Furthermore, we revealed that the loss of NG2 glial cell-derived hepatocyte growth factor (HGF) exacerbated these abnormalities. Our findings suggest that NG2 glial cells maintain neuronal function and survival via the control of neuroimmunological function.


Conflict of interest statement

The authors declare no competing financial interests.

Figures

Figure 1
Figure 1. Characterization of NG2-HSVtk transgene and transgenic rats.
(a) Schematic diagram of the engineered NG2-HSVtk BAC construct. Diagram 1 depicts the structure of the Rattus norvegicus NG2 gene (not to scale). Exons are indicated as white blocks. The regions used for 5′ and 3′ homology arms are indicated. Diagram 2 depicts the structure of the NG2_HSV-TK shuttle vector that was used to modify the BAC DNA in order to insert the HSV-TK cDNA into the BAC clone that contained the NG2 gene in the center. Diagram 3 depicts the structure of the modified BAC DNA that was used for microinjection into fertilized oocytes. (b) PCR genotyping of tail DNA from NG2-HSVtk transgenic rats. (c) Confocal images (magnified views in white boxes) of immunoreactivity for HSVtk (TK, green in the merged image), NG2 (NG2, magenta in the merged image) and Olig2 (Olig2, cyan in the merged image) in the hippocampus of NG2-HSVtk transgenic rats. (d) Confocal image showing a polydendritic NG2 glial cell that was immunopositive for HSVtk, NG2, and Olig2; and also showing a pericyte that was immunopositive for HSVtk and NG2 but not for Olig2. (e) Confocal images (magnified views in white boxes) of glial fibrillary acidic protein (GFAP, a marker of astrocytes), Iba1 (a marker of microglia), myelin basic protein (MBP, a marker of oligodendrocyte), and NeuN (a marker of neuronal nuclei), with TK (HSVtk) in the hippocampus of NG2 transgenic rats. Scale bars represent 100 μm (c,e) and 10 μm (d).
Figure 2
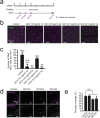
Figure 2. Ablation of NG2 glial cells in the hippocampus of NG2-HSVtk transgenic rats.
(a) Timeline of the experimental design for the treatment with vehicle and ganciclovir (GCV). (b) Confocal images of immunoreactivity for Olig2 (Olig2, green) and NG2 (NG2, magenta) in NG2-HSVtk transgenic rats treated with vehicle (Control) or GCV at doses of 10 and 0.5 mg/ml for 1, 2 or 7 days [GCV (10 mg/ml) 1d, GCV (10 mg/ml) 2d, GCV (0.5 mg/ml) 2d, GCV (0.5 mg/ml) 1w]. (c) The number of NG2 glial cells (immunopositive cells for Olig2 and NG2) in animals treated with vehicle or GCV. Mean ± SD, n = 3 rats [Control, GCV (0.5 mg/ml) 2d, GCV (0.5 mg/ml) 1w] or 5 rats [GCV (10 mg/ml) 1d, GCV (10 mg/ml) 2d]; ***p < 0.001, based on a one-way analysis of variance (ANOVA) followed by Tukey-Kramer test. (d) Confocal images of immunoreactivity for PDGFRβ (a marker of pericytes; magenta) and Glut1 (a marker of endothelial cells; green) in animals treated with vehicle or GCV for 1, 2, or 3 days. (e) Percentages of pericyte coverage in animals treated with vehicle or GCV. The pericyte coverage was determined as a ratio (%) of PDGFRβ-positive area on the Glut1-positive capillary to the total Glut1-positive area. Mean ± SD, n = 3 rats (Control, GCV1d, GCV2d, and GCV3d); N.S., non-significant, p > 0.05, based on a one-way ANOVA followed by Tukey-Kramer test (c,e). Scale bars represent 100 μm (b,d).
Figure 3
Figure 3. Ablation of NG2 glial cells induces neurodegeneration in the hippocampus.
(a) Confocal images of immunoreactivity for microtubule-associated protein 2 (MAP2, green) in NG2-HSVtk transgenic rats treated with vehicle (Control) or GCV at a dose of 10 mg/ml for 1 day (GCV1d). Lower panels show magnified views of those images presented in yellow boxes in the upper panels. Hoechst, cell nuclear staining. (b) Bright-field immunohistochemical observations of NeuN in the hippocampal CA1 region of NG2-HSVtk transgenic rats treated with vehicle or GCV at doses of 10 and 0.5 mg/ml for 1, 2, 3 or 7 days [GCV (10 mg/ml) 1d, GCV (10 mg/ml) 2d, GCV (10 mg/ml) 3d, GCV (0.5 mg/ml) 2d, GCV (0.5 mg/ml) 1w]. Black boxes in GCV (10 mg/ml) 3d show magnification of the microscopic view. (c) The number of NeuN positive cells in the hippocampus of NG2-HSVtk transgenic rats treated with vehicle or GCV at doses of 10 and 0.5 mg/ml for 1, 2, 3 or 7 days. Photomicrographs indicate representative images for viable (viable, white) and damaged neurons (impairment, grey). (d) Confocal images showing TUNEL (green) and immunoreactivity for NeuN (magenta) in the hippocampal CA2 region of NG2-HSVtk transgenic rats treated with GCV at a dose of 10 mg/ml for 3 days. Mean ± SD, n = 3 rats [Control, GCV (10 mg/ml) 3d, GCV (0.5 mg/ml) 2d, GCV (0.5 mg/ml) 1w] or 5 rats [GCV (10 mg/ml) 1d, GCV (10 mg/ml) 2d]; *p < 0.05, based on a one-way ANOVA followed by Tukey-Kramer test. Scale bars represent 100 μm (a,b) and 50 μm (d).
Figure 4
Figure 4. Ablation of NG2 glial cells induces neuroinflammation and activates microglia in the hippocampus.
(a) Bright-field immunohistochemical observations of Iba1 in NG2-HSVtk transgenic rats treated with vehicle (Control) or GCV for 1, 2, or 3 days (GCV1d, GCV2d, GCV3d). Black arrowheads indicate the CA1 pyramidal cell layer. (b) Relative expression levels of interleukin-1β (IL-1β), interleukin-6 (IL-6), and tumor necrosis factor α (TNFα) mRNAs in the hippocampal tissue of NG2-HSVtk transgenic rats treated with vehicle or GCV for 1, 2, or 3 days. (c) Immunoblotting of NG2 and precursor protein of TNFα (pro-TNFα) in the hippocampal tissue of NG2-HSVtk transgenic rats treated with vehicle or GCV for 1, 2, or 3 days. Glyceraldehyde 3-phosphate dehydrogenase (GAPDH) was used as a loading control. (d) Confocal images (magnified views in white boxes) of immunoreactivity for TNF receptor 1 (TNFR1) and NeuN in the hippocampal CA2 region in NG2-HSVtk transgenic rats. Mean ± SD, n = 3 rats (Control, GCV3d) and 4 rats (GCV1d, GCV2d); *p < 0.05, **p < 0.01 or ***p < 0.001, based on a one-way ANOVA followed by Tukey-Kramer test. Scale bars represent 100 μm (a,d).
Figure 5
Figure 5. Inhibition of microglial activation attenuates the NG2 glial cell ablation-induced hippocampal cell death.
(a) Timeline of the experimental design for the treatment with minocycline. (b) Immunohistochemical observations of Iba1 (upper panels) and NeuN (lower panels) in the hippocampal CA1 region of NG2-HSVtk transgenic rats treated with vehicle (Control), GCV for 2 days (GCV2d), or co-treatment with GCV and minocycline (45 mg/kg/day) for 2 days (GCV2d + minocycline). (c) The number of viable CA1 pyramidal neurons in NG2-HSVtk transgenic rats treated with vehicle (n = 3), GCV for 2 days (n = 6), or co-administration of GCV and minocycline (n = 3). p = 0.024, based on a the Student’s t-test analysis. Scale bars represent 100 μm (b).
Figure 6
Figure 6. Suppression of IL-1β pro-inflammatory pathway attenuates the NG2 glial cell ablation-induced hippocampal cell death.
(a) Timeline of the experimental design for the treatment with rat recombinant IL-1 receptor antagonist (rrIL-1ra). (b) Bright-field immunohistochemical observations of NeuN in the hippocampal CA1 region of NG2-HSVtk transgenic rats treated with vehicle (Control), GCV for 2 days (GCV2d), or co-administration of GCV and IL-1ra (1 μg/day) for 2 days following IL-1ra administration for 5 days (GCV2d + IL-1ra). (c) Relative expression levels of TNFα mRNAs in the hippocampi of NG2-HSVtk transgenic rats treated with vehicle (Control, value set as 1.0), GCV for 1 day, or co-administration of GCV and IL-1ra for 1 day following IL-1ra administration for 5 days. (d) Confocal images depicting microglia (Iba1, green) in the hippocampus CA1 region of NG2-HSVtk transgenic rats treated with vehicle, GCV for 2 days, or co-administration of GCV and IL-1ra for 2 days following IL-1ra administration for 5 days. Hoechst, cell nuclear staining. Mean ± SD, n = 2 rats (Control) and 3 rats (GCV1d, GCV2d, GCV1d + IL-1ra, GCV2d + IL-1ra); *p < 0.05, based on a Student’s t-test analysis. Scale bars represent 100 μm (b) and 20 μm (d).
Figure 7
Figure 7. Ablation of NG2 glial cells induces the reduction of HGF in the hippocampus.
(a) Confocal images of immunoreactivity for hepatocyte growth factor (HGF) (green), NG2 (magenta), and Olig2 (cyan) in NG2-HSVtk transgenic rats. (b) Relative expression levels of HGF mRNA in the hippocampus of NG2-HSVtk transgenic rats treated with vehicle (Control, the value as 1.0) or GCV for 1, 2, 3 days (GCV1d, GCV2d, GCV3d). (c) Relative protein abundance of HGF evaluated based on a densitometry analysis using ImageJ in the hippocampus of NG2-HSVtk transgenic rats treated with vehicle (Control, the value as 1.0) or GCV for 1, 2, or 3 days. The amount of total protein was used as a loading control. Mean ± SD, n = 3 animals (Control, GCV3d) or 4 animals (GCV1d, GCV2d); *p < 0.05 or ***p < 0.005, based on a one-way ANOVA followed by Tukey-Kramer test (b,c). Scale bar represents 50 μm (a).
Figure 8
Figure 8. NG2 glial cell-derived HGF supports the survival of hippocampal neurons.
(a) Timeline of the experimental design for the treatment with mouse recombinant HGF (mrHGF). (b) Bright-field immunohistochemical observations of NeuN in the hippocampal CA1 region of NG2-HSVtk transgenic rats treated with vehicle (Control), GCV for 2 days (GCV2d), or co-administration of GCV and HGF (4.3 μg/day) for 2 days (GCV2d + HGF). (c) The number of viable neurons in NG2-HSVtk transgenic rats treated with vehicle (n = 2), GCV for 2 days (n = 3), co-administration of GCV and IL-1ra (GCV2d + IL-1ra, n = 3), or co-administration of GCV and HGF (GCV2d + HGF, n = 4). (d) Confocal images showing microglia (Iba1, green) in the hippocampal CA1 region of NG2-HSVtk transgenic rats treated with vehicle, GCV for 2 days, or co-administration of GCV and HGF for 2 days. Hoechst, cell nuclear staining. (e) Relative expression levels of Bcl-2 mRNA in the hippocampus of NG2-HSVtk transgenic rats treated with vehicle (Control, value set as 1.0) or GCV for 1, 2, or 3 days. n = 3 animals (Control, GCV3d) and 5 animals (GCV1d, GCV2d). (f) Relative expression levels of Bcl-2 mRNA in the hippocampi of rats treated with vehicle (Control, value set as 1.0, n = 2), GCV for 1 days (n = 3), or co-administration of GCV and HGF for 1 day (n = 3). Mean ± SD; *p < 0.05 or **p < 0.01, based on a one-way ANOVA followed by Tukey-Kramer test (c,e). #p = 0.05, based on a Student’s t-test analysis (f). Scale bars represent 100 μm (b) or 20 μm (d).

Similar articles

Cited by

References

    1. Dawson M. R. L., Polito A., Levine J. M. & Reynolds R. NG2-expressing glial progenitor cells: An abundant and widespread population of cycling cells in the adult rat CNS. Mol. Cell. Neurosci. 24, 476–488 (2003). - PubMed
    1. Nishiyama A., Komitova M., Suzuki R. & Zhu X. Polydendrocytes (NG2 cells): multifunctional cells with lineage plasticity. Nat. Rev. Neurosci. 10, 9–22 (2009). - PubMed
    1. Kang S. H., Fukaya M., Yang J. K., Rothstein J. D. & Bergles D. E. NG2+ CNS glial progenitors remain committed to the oligodendrocyte lineage in postnatal life and following neurodegeneration. Neuron 68, 668–681 (2010). - PMC - PubMed
    1. Hughes E. G., Kang S. H., Fukaya M. & Bergles D. E. Oligodendrocyte progenitors balance growth with self-repulsion to achieve homeostasis in the adult brain. Nat. Neurosci. 16, 668–676 (2013). - PMC - PubMed
    1. McTigue D. M., Wei P. & Stokes B. T. Proliferation of NG2-positive cells and altered oligodendrocyte numbers in the contused rat spinal cord. J. Neurosci. 21, 3392–3400 (2001). - PMC - PubMed

Publication types