. 2017 Apr 1;130(7):1251-1262.
doi: 10.1242/jcs.196188. Epub 2017 Feb 13.

Error-prone meiotic division and subfertility in mice with oocyte-conditional knockdown of pericentrin

Affiliations

Error-prone meiotic division and subfertility in mice with oocyte-conditional knockdown of pericentrin

Claudia Baumann et al. J Cell Sci. .

Abstract

Mouse oocytes lack canonical centrosomes and instead contain unique acentriolar microtubule-organizing centers (aMTOCs). To test the function of these distinct aMTOCs in meiotic spindle formation, pericentrin (Pcnt), an essential centrosome/MTOC protein, was knocked down exclusively in oocytes by using a transgenic RNAi approach. Here, we provide evidence that disruption of aMTOC function in oocytes promotes spindle instability and severe meiotic errors that lead to pronounced female subfertility. Pcnt-depleted oocytes from transgenic (Tg) mice were ovulated at the metaphase-II stage, but show significant chromosome misalignment, aneuploidy and premature sister chromatid separation. These defects were associated with loss of key Pcnt-interacting proteins (γ-tubulin, Nedd1 and Cep215) from meiotic spindle poles, altered spindle structure and chromosome-microtubule attachment errors. Live-cell imaging revealed disruptions in the dynamics of spindle assembly and organization, together with chromosome attachment and congression defects. Notably, spindle formation was dependent on Ran GTPase activity in Pcnt-deficient oocytes. Our findings establish that meiotic division is highly error-prone in the absence of Pcnt and disrupted aMTOCs, similar to what reportedly occurs in human oocytes. Moreover, these data underscore crucial differences between MTOC-dependent and -independent meiotic spindle assembly.

Keywords: MTOC; Meiosis; Microtubule-organizing center; Oocyte; Pericentrin; Spindle.


Conflict of interest statement

Competing interests

The authors declare no competing or financial interests.

Figures
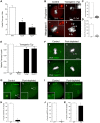
Fig. 1.
Fig. 1.
Oocyte-conditional knockdown of Pcnt disrupts aMTOC-associated protein localization and lowers female fertility. (A) Mean±s.e.m. number of viable pups per litter born to WT (n=3) and Tg (n=3) female mice mated to WT males during a 6-month period. (B) Representative images of prophase-I (GV-stage) and ovulated oocytes (MII) collected from WT and Tg females. DAPI-labeled DNA is shown in gray and Pcnt in red. Insets show 6× (a) and 3× (b,c) magnifications. Arrowheads denote misaligned chromosomes. G.Cell, granulosa cells. (C) Percentage (mean±s.e.m.) of total WT (n=79) and Tg (n=61) ovulated MII oocytes that show positive immunofluorescence Pcnt labeling. (D) Fluorescence intensity of Pcnt at aMTOCs in ovulated MII WT (n=20) and Tg (n=21) oocytes. (E) Relative transcript levels for Pcnt (Pcnt), γ-tubulin (Tubg1) and the γ-tubulin adaptor protein neural precursor cell expressed, developmentally down-regulated 1 (Nedd1) in ovulated oocytes (n=100) from control (WT) and transgenic (Tg) females. (F) Representative images of WT and Tg (Pcnt-depleted) oocytes, labeled with anti-Nedd1 (green) or anti-Cep215 (green). DAPI-labeled DNA is shown in gray. Arrowhead denotes misaligned chromosome. Scale bar of 10 μm. (G) Representative images of prophase-1 arrested WT and Tg oocytes, labeled with anti-γ-tubulin (green). The arrowhead denotes an aMTOC. Insets show a 6× magnification. (H) Percentage (mean±s.e.m.) of total WT (n=44) and Tg (n=42) prophase-I arrested oocytes that label positively for γ-tubulin at aMTOCs. (I) Representative images of ovulated MII WT and Tg oocytes, labeled with anti-γ-tubulin (green). Insets show a 2× magnification. Percentage (mean±s.e.m.) of total WT (n=90) and Tg (n=98) MII oocytes showing positive labeling for (I) γ-tubulin at the spindle poles and cytoplasmic aMTOC foci, or (J) γ-tubulin along the spindle microtubules (MTs). *P<0.05; ***P<0.001 relative to WT. Scale bars: 10 μm.
Fig. 2.
Fig. 2.
Loss of Pcnt promotes increased chromosome attachment errors and aneuploidy. (A) Representative images of ovulated MII oocytes from control (WT) and transgenic (Tg) females, labeled with anti-Pcnt (pink) and anti-acetylated α-tubulin (green) to detect spindle MTs. DNA is shown in red. The arrowhead denotes misaligned chromosome at the spindle pole. (B) Percentage (mean±s.e.m.) of total WT (n=32) and Tg (n=52) ovulated oocytes with misaligned chromosomes. (C) Chromosome spreads from WT and Tg (Pcnt-depleted) ovulated MII oocytes. Centromeres (red) were labeled with anti-CREST antibodies and the chromosomes (blue) were counterstained with DAPI. Arrowheads denote prematurely separated sister chromatids (PCCS). (D) Percentage (mean±s.e.m.) of chromosome spreads from WT (n=32) and Tg (n=52) oocytes that show aneuploidy or PCCS. (E) Kinetochore–MT attachments were analyzed in WT (a, n=10) and Tg (b, n=10) MI-stage oocytes. Centromeres (red) are labeled with anti-CREST, MTs (green) with anti-tubulin, and the chromosomes (blue) were counterstained with DAPI. Representative images of (c) end-on, (d) unattached and (e) merotelic attachments are shown. (F) Classification of total WT (n=360) and Tg (n=333) attachments assessed. **P<0.01; ***P<0.001 relative to WT. Scale bars: 10 μm.
Fig. 3.
Fig. 3.
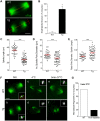
Loss of Pcnt disrupts meiotic spindle organization and MT re-growth in oocytes. (A) Representative images of meiotic spindle MTs (green) organization in ovulated WT and Tg oocytes used for morphometric analysis. (B) Percentage (mean±s.e.m.) of spindles that were classified as being smaller in WT (n=32) and Tg (n=61) oocytes. (C–F) Comparisons of the (mean±s.e.m.) (C) meiotic spindle length, (D) average spindle pole diameter and (E) ratio of the pole diameter:spindle length. (F) Representative images of ovulated WT control (a,c,e; n=82) and Tg Pcnt-depleted (b,d,f; n=71) oocytes following cold treatment for 1 h at 4°C to depolymerize MTs and microtubule regrowth for 5 min at 37°C. The oocytes were double labeled with anti-Pcnt (red) and anti-acetylated α-tubulin (green) to detect spindle MTs. DNA was counterstained with DAPI (gray). (G) Percentage of oocytes that exhibit MT regrowth after rewarming for 5 min at 37°C. *P<0.05; ***P<0.001 relative to WT. Scale bars: 10 μm.
Fig. 4.
Fig. 4.
Progression of meiosis in WT and Tg oocytes as assessed by live-cell imaging. Quantification of the timing of meiotic progression in live WT (n=21) and Tg (n=28) oocytes expressing H2B–RFP and MAP4–EGFP, which label the chromosomes (red) and spindle MTs (green), respectively. Scatter plots represent the mean±s.e.m. time (h) during which oocytes undergo key transitions including, (A) GVB and the resumption of meiosis, (B) chromosome congression at MI, (C) chromosome segregation at the anaphase–telophase-I transition and (D) chromosome congression at MII. **P<0.01; ***P<0.001; n.s., not significant relative to WT. (E) Representative time-lapse images (maximum intensity z-projections, 5 µm intervals, 100 µm range) of WT and Tg oocytes at MI and at the anaphase–telophase-I transition. Arrowheads denote misaligned or lagging chromosomes. (F) Percentage of oocytes that show misaligned chromosomes during meiosis I.
Fig. 5.
Fig. 5.
Meiotic spindle assembly in WT and Tg oocytes as assessed by live-cell imaging. Meiotic spindle assembly and organization was assessed during meiotic division in live oocytes. (A) Time-lapse images (maximum intensity z-projections, 5 µm intervals, 100 µm range) showing key stages of meiosis in WT (n=21) and Tg (n=28) oocytes expressing H2B–RFP and MAP4–EGFP that label the chromosomes (red) and spindle MTs (green), respectively. Arrowheads denote misaligned chromosomes. Pb, polar body. Scale bar: 10 μm. (B–F) Scatter plots represent the mean (±s.e.m) time (h) during which oocytes undergo key stages of spindle MT organization as shown in A, including: (B) onset of MT nucleation around the condensing chromosomes, (C) growing MT-aster formation during prometaphase-I, (D) formation of the early MI spindle, (E) bipolar spindle formation during MI, as well as (F) bipolar spindle formation during MII. (G) Percentage of oocytes that show misaligned chromosomes at MII. **P<0.01; ***P<0.001 relative to WT.
Fig. 6.
Fig. 6.
Spindle assembly in Tg (Pcnt-depleted) oocytes is dependent on Ran activity. Meiotic spindle assembly was assessed by live-cell imaging in Tg oocytes microinjected with a mutant form of Ran (RanT24N) and compared to that seen in Tg controls. (A) Representative time-lapse images (maximum intensity z-projections, 5 µm intervals, 100 µm range) showing key stages of meiosis-I in Tg (n=12) and Tg RanT24N-injected (n=15) oocytes expressing H2B–RFP and MAP4–EGFP, which label the chromosomes (red) and spindle MTs (green), respectively. Scale bar: 10 μm. (B) Percentage of Tg-RanT24N oocytes that show either no MT formation, or late onset of MT nucleation, around the condensing chromosomes upon the resumption of meiosis. (C) Time (h) post GVB of MT nucleation onset in Tg and Tg-RanT24N oocytes. GVB was set to 0 h. The box represents the 25–75th percentiles, and the median is indicated. The whiskers show the minimum to maximum time (h). ***P<0.001.

Similar articles

Cited by

References

    1. Azoury J., Lee K. W., Georget V., Rassinier P., Leader B. and Verlhac M.-H. (2008). Spindle positioning in mouse oocytes relies on a dynamic meshwork of actin filaments. Curr. Biol. 18, 1514-1519. 10.1016/j.cub.2008.08.044 - DOI - PubMed
    1. Baumann C. and Viveiros M. M. (2015). Meiotic spindle assessment in mouse oocytes by siRNA-mediated silencing. J. Vis. Exp. 104, e53586 10.3791/53586 - DOI - PMC - PubMed
    1. Baumann C., Viveiros M. M. and De La Fuente R. (2010). Loss of maternal ATRX results in centromere instability and aneuploidy in the mammalian oocyte and pre-implantation embryo. PLoS Genet. 6, e1001137 10.1371/journal.pgen.1001137 - DOI - PMC - PubMed
    1. Bowne-Anderson H., Hibbel A. and Howard J. (2015). Regulation of microtubule growth and catastrophe: unifying theory and experiment. Trends Cell Biol. 25, 769-779. 10.1016/j.tcb.2015.08.009 - DOI - PMC - PubMed
    1. Carazo-Salas R. E., Gruss O. J., Mattaj I. W. and Karsenti E. (2001). Ran-GTP coordinates regulation of microtubule nucleation and dynamics during mitotic-spindle assembly. Nat. Cell Biol. 3, 228-234. 10.1038/35060009 - DOI - PubMed

Publication types