. 2017 Apr 1;26(7):1318-1327.
doi: 10.1093/hmg/ddx049.

Sex specific activation of the ERα axis of the mitochondrial UPR (UPRmt) in the G93A-SOD1 mouse model of familial ALS

Affiliations

Sex specific activation of the ERα axis of the mitochondrial UPR (UPRmt) in the G93A-SOD1 mouse model of familial ALS

Amanjot K Riar et al. Hum Mol Genet. .

Abstract

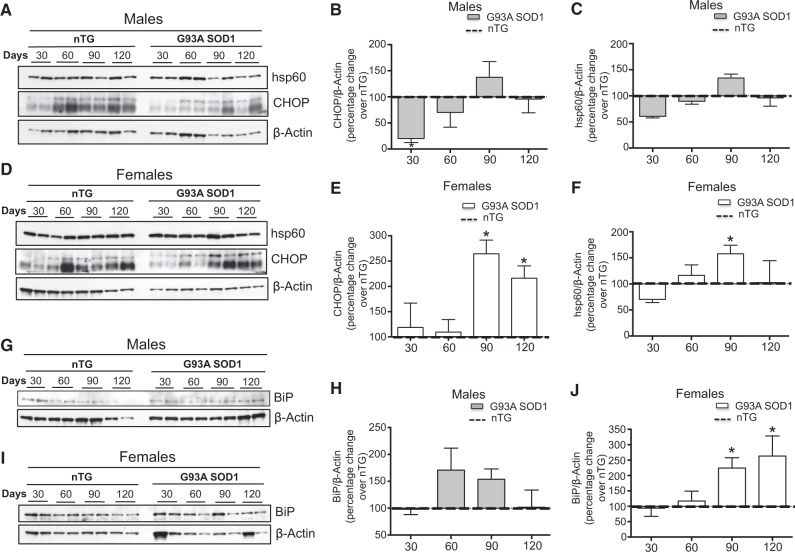
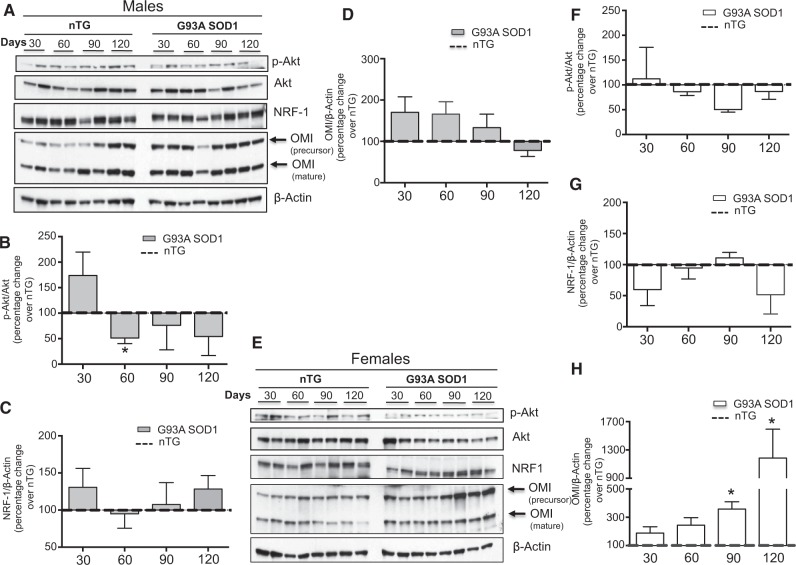
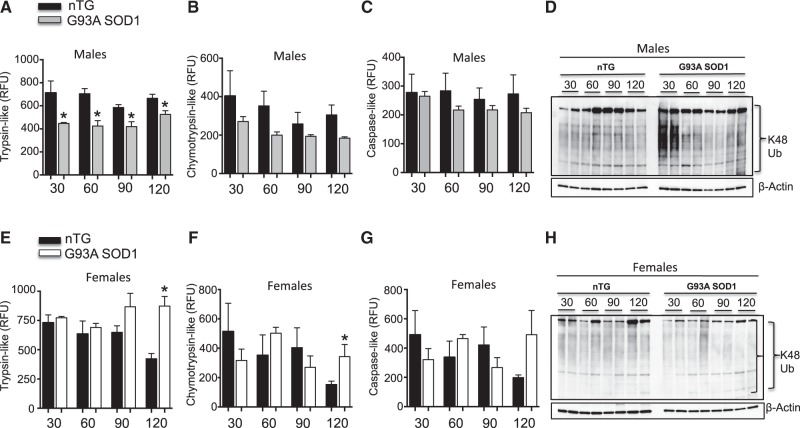
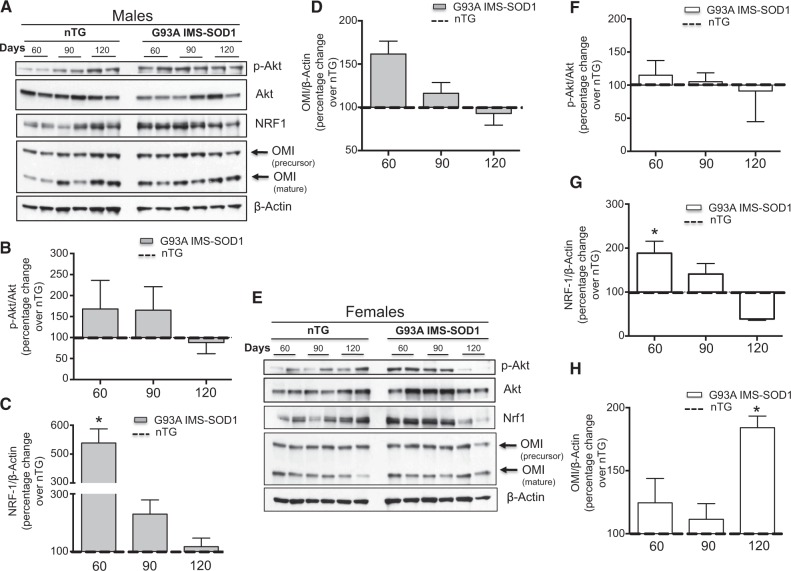
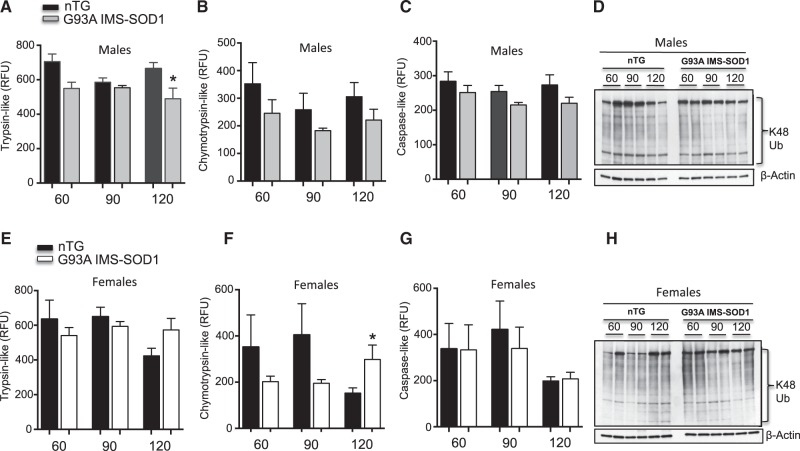
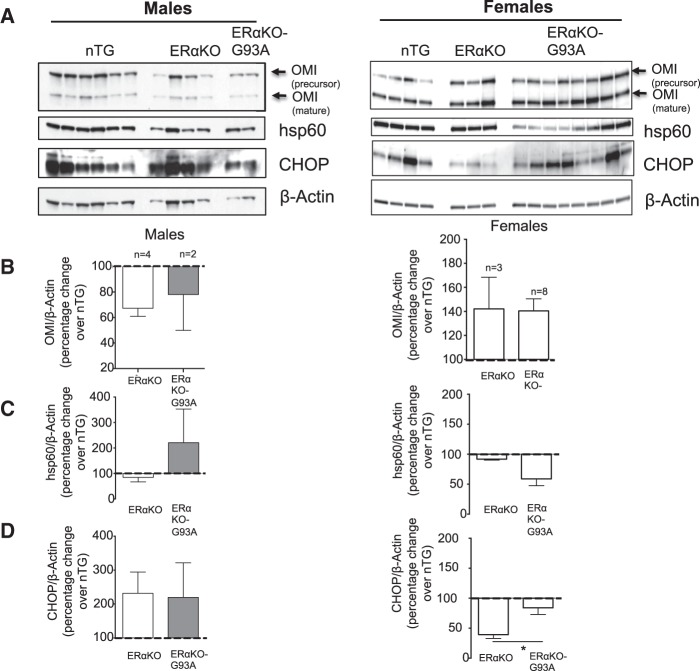
The mitochondrial unfolded protein response (UPRmt) is a transcriptional program aimed at restoring proteostasis in mitochondria. Upregulation of mitochondrial matrix proteases and heat shock proteins was initially described. Soon thereafter, a distinct UPRmt induced by misfolded proteins in the mitochondrial intermembrane space (IMS) and mediated by the estrogen receptor alpha (ERα), was found to upregulate the proteasome and the IMS protease OMI. However, the IMS-UPRmt was never studied in a neurodegenerative disease in vivo. Thus, we investigated the IMS-UPRmt in the G93A-SOD1 mouse model of familial ALS, since mutant SOD1 is known to accumulate in the IMS of neural tissue and cause mitochondrial dysfunction. As the ERα is most active in females, we postulated that a differential involvement of the IMS-UPRmt could be linked to the longer lifespan of females in the G93A-SOD1 mouse. We found a significant sex difference in the IMS-UPRmt, because the spinal cords of female, but not male, G93A-SOD1 mice showed elevation of OMI and proteasome activity. Then, using a mouse in which G93A-SOD1 was selectively targeted to the IMS, we demonstrated that the IMS-UPRmt could be specifically initiated by mutant SOD1 localized in the IMS. Furthermore, we showed that, in the absence of ERα, G93A-SOD1 failed to activate OMI and the proteasome, confirming the ERα dependence of the response. Taken together, these results demonstrate the IMS-UPRmt activation in SOD1 familial ALS, and suggest that sex differences in the disease phenotype could be linked to differential activation of the ERα axis of the IMS-UPRmt.


Figures

Figure 1
Figure 1
The CHOP/hsp60 axis is activated during the symptomatic phase in the G93A-SOD1 model of fALS. (A) Representative western blot of hsp60 and CHOP in 2 non-transgenic males and 2 G93A-SOD1 males at day 30, 60, 90 and 120. β-actin was used as a loading control. (B) Quantification of the level of CHOP at each time point in males. n = 4. The level of CHOP relative to β-actin was determined for 4 non-transgenic males and the average of the 4 values set to 100 percent for each time point. The average level of CHOP relative to β-actin was also determined in 4 G93A-SOD1 transgenic males at each time point and expressed as a percentage change relative to the non-transgenic males (dotted line). (C) Quantification of the level of hsp60 in males, as in B. n = 4. (D) Representative western blot of hsp60 and CHOP in 2 non-transgenic females and 2 G93A-SOD1 females at day 30, 60, 90 and 120. β-actin was used as a loading control. (E) Quantification of the level of CHOP in females, as in B. n = 4. (F) Quantification of the level of hsp60 in females, as in B. n = 4. (G) Representative western blot of BiP in 2 non-transgenic males and 2 G93A-SOD1 males at day 30, 60, 90 and 120. β-actin was used as a loading control. (H) Quantification of the level of BiP in males, as in B. n = 4. (I) Representative western blot of BiP in 2 non-transgenic females and 2 G93A-SOD1 females at day 30, 60, 90 and 120. β-actin was used as a loading control. (J) Quantification of the level of BiP in females, as in B. n = 4. *P <0.05 when compared to the respective non-transgenic.
Figure 2
Figure 2
The UPRmt is activated during the symptomatic phase the G93A-SOD1 model of fALS. (A) Representative western blot of phospho-Akt, Akt, NRF-1 and OMI in 2 non-transgenic males and 2 G93A-SOD1 males at day 30, 60, 90 and 120. β-actin was used as a loading control. (B) Quantification of the ratio of phospho-Akt to total Akt at each time point in males. n = 4. The ratio of phospho-Akt to total Akt was determined for 4 non-transgenic males and the average of the 4 values set to 100 percent for each time point. The ratio of phospho-Akt to total Akt was also determined in 4 G93A-SOD1 transgenic males at each time point and expressed as a percentage change relative to the non-transgenic males value (dotted line). (C) Quantification of the level of NRF-1 in males, as in in B. n = 4. (D) Quantification of the level of OMI in males, as in B. n = 4. (E) Representative western blot of phospho-Akt, Akt, NRF-1 and OMI in 2 non-transgenic females and 2 G93A-SOD1 females at day 30, 60, 90 and 120. β-actin was used as a loading control. (F) Quantification of the ratio of phospho-Akt to total Akt in females, as in B. n = 4. (G) Quantification of the level of NRF-1 in females, as in B. n = 4. (H) Quantification of the level of OMI in females, as in B. n = 4. *P <0.05 when compared to the respective non-transgenic.
Figure 3
Figure 3
Proteasome activity is decreased in G93A-SOD1 males. (A) The trypsin-like activity of the 26S proteasome in 4 non-transgenic males (black bar) and 4 G93A-SOD1 males (gray bar). n = 4. (B) The chymotrypsin-like activity of the 26S proteasome in 4 non-transgenic males (black bar) and 4 G93A-SOD1 transgenic males (gray bar). n = 4. (C) The caspase-like activity of the 26S proteasome in 4 non-transgenic males (black bar) and 4 G93A-SOD1 transgenic males (gray bar). n = 4. (D) Representative Western blot of total lysine 48 ubiquitin chains in 2 non-transgenic and 2 G93A-SOD1 transgenic males. β-actin was used as a loading control. (E) The trypsin-like activity of the 26S proteasome in 4 non-transgenic females (black bar) and 4 G93A-SOD1 transgenic females (gray bar). n = 4. (F) The chymotrypsin-like activity of the 26S proteasome in 4 non-transgenic females (black bar) and 4 G93A-SOD1 transgenic females (gray bar). n = 4. (G) The caspase-like activity of the 26S proteasome in 4 non-transgenic females (black bar) and 4 G93A-SOD1 transgenic females (gray bar). n = 4. (H) Representative Western blot of total lysine-48 ubiquitin chains in 2 non-transgenic and 2 G93A-SOD1 transgenic females. β−actin was used as a loading control. *P <0.05 when compared to the respective non-transgenic.
Figure 4
Figure 4
The UPRmt is activated in G93A IMS-SOD1 mice. (A) Representative western blot of phospho-Akt, Akt, NRF-1 and OMI in 2 non-transgenic males and 2 G93A IMS-SOD1 males at day 60, 90 and 120. β-actin was used as a loading control. (B) Quantification of the ratio of phospho-Akt to total Akt at each time point in males. n = 4. The ratio of phospho-Akt to total Akt was determined for 4 non-transgenic males and the average of the 4 values set to 100 percent for each time point. The ratio of phospho-Akt to total Akt was also determined in 4 G93A IMS-SOD1 transgenic males and the average of these 4 values was expressed as a percentage change relative to the non-transgenic males (dotted line). (C) Quantification of the level of NRF-1 in males, as in B. n = 4. (D) Quantification of the level of OMI in males, as in B. n = 4. (E) Representative western blot of phospho-Akt, Akt, NRF-1 and OMI in 2 non-transgenic females and 2 G93A IMS-SOD1 females at day 60, 90 and 120. β-actin was used as a loading control. (F) Quantification of the ratio of phospho-Akt to total Akt in females, as in B. n = 4. (G) Quantification of the level of NRF-1 in females, as in B. n = 4. (H) Quantification of the level of OMI in females, as in B. n = 4. *P <0.05 when compared to the respective non-transgenic.
Figure 5
Figure 5
Monitoring the proteasome activity in the G93A IMS-SOD1 mouse model over disease progression. (A) The trypsin-like activity of the 26S proteasome in 4 non-transgenic males (black bar) and 4 G93A IMS-SOD1 transgenic males (gray bar). n = 4. (B) The chymotrypsin-like activity of the 26S proteasome in 4 non-transgenic males (black bar) and 4 G93A IMS-SOD1 transgenic males (gray bar). n = 4. (C) The caspase-like activity of the 26S proteasome in 4 non-transgenic males (black bar) and 4 G93A IMS-SOD1 transgenic males (gray bar). n = 4. (D) Representative Western blot of total lysine 48 ubiquitin chains in 2 non-transgenic and 2 G93A IMS-SOD1 transgenic males. β-actin was used as a loading control. (E) The trypsin-like activity of the 26S proteasome in 4 non-transgenic females (black bar) and 4 G93A IMS-SOD1 transgenic females (gray bar). n = 4. (F) The chymotrypsin-like activity of the 26S proteasome in 4 non-transgenic females (black bar) and 4 G93A IMS-SOD1 transgenic females (gray bar). n = 4. (G) The caspase-like activity of the 26S proteasome in 4 non-transgenic females (black bar) and 4 G93A IMS-SOD1 transgenic females (gray bar). n = 4. (H) Representative Western blot of total lysine-48 ubiquitin chains in 2 non-transgenic and 2 IMS-only G93A-SOD1 transgenic females. β-actin was used as a loading control. *P <0.05 when compared to respective non-transgenic.
Figure 6
Figure 6
Genetic ablation of the ERα abolishes the activation of OMI but stimulates the CHOP/hsp60 axis of the UPRmt. (A) Western blot of non-transgenic, ERαKO or ERαKO-G93A males (left) and females (right) of OMI, hsp60 and CHOP. β-actin is used as a loading control. All mice were harvested at day 60. (B) Quantification of the ratio of OMI to β−actin. For this experiment the number of mice per group varied: non-transgenic males, n = 6, ERαKO males, n= 4, ERαKO-G93A knockout males, n = 2, non-transgenic females, n = 4, ERαKO females, n = 3, ERαKO-G93A females, n = 8. Because n = 2 in some groups, the males and the females were combined to perform statistical analyses. (C) Quantification of the level of hsp60 in non-transgenic, ERαKO or ERαKO-G93A males and females. The quantification was performed as described in B. (D) Quantification of the level of CHOP in non-transgenic, ERαKO or ERαKO-G93A males and females. The quantification was performed as described in B. *P <0.05 when compared to respective non-transgenic.

Similar articles

Cited by

References

    1. Rosen D.R. (1993) Mutations in Cu/Zn superoxide dismutase gene are associated with familial amyotrophic lateral sclerosis. Nature, 364, 362.. - PubMed
    1. Ilieva H., Polymenidou M., Cleveland D.W. (2009) Non-cell autonomous toxicity in neurodegenerative disorders: ALS and beyond. J. Cell Biol., 187, 761–772. - PMC - PubMed
    1. Hervias I., Beal M.F., Manfredi G. (2006) Mitochondrial dysfunction and amyotrophic lateral sclerosis. Muscle Nerve., 33, 598–608. - PubMed
    1. Shi P., Gal J., Kwinter D.M., Liu X., Zhu H. (2010) Mitochondrial dysfunction in amyotrophic lateral sclerosis. Biochim. Biophys. Acta, 1802, 45–51. - PMC - PubMed
    1. Gurney M.E., Pu H., Chiu A.Y., Dal Canto M.C., Polchow C.Y., Alexander D.D., Caliendo J., Hentati A., Kwon Y.W., Deng H.X., and., et al. (1994) Motor neuron degeneration in mice that express a human Cu,Zn superoxide dismutase mutation. Science, 264, 1772–1775. - PubMed

Publication types

MeSH terms

Substances

Supplementary concepts