

The plant defensin NaD1 induces tumor cell death via a non-apoptotic, membranolytic process
- PMID: 28179997
- PMCID: PMC5253418
- DOI: 10.1038/cddiscovery.2016.102
The plant defensin NaD1 induces tumor cell death via a non-apoptotic, membranolytic process
Abstract
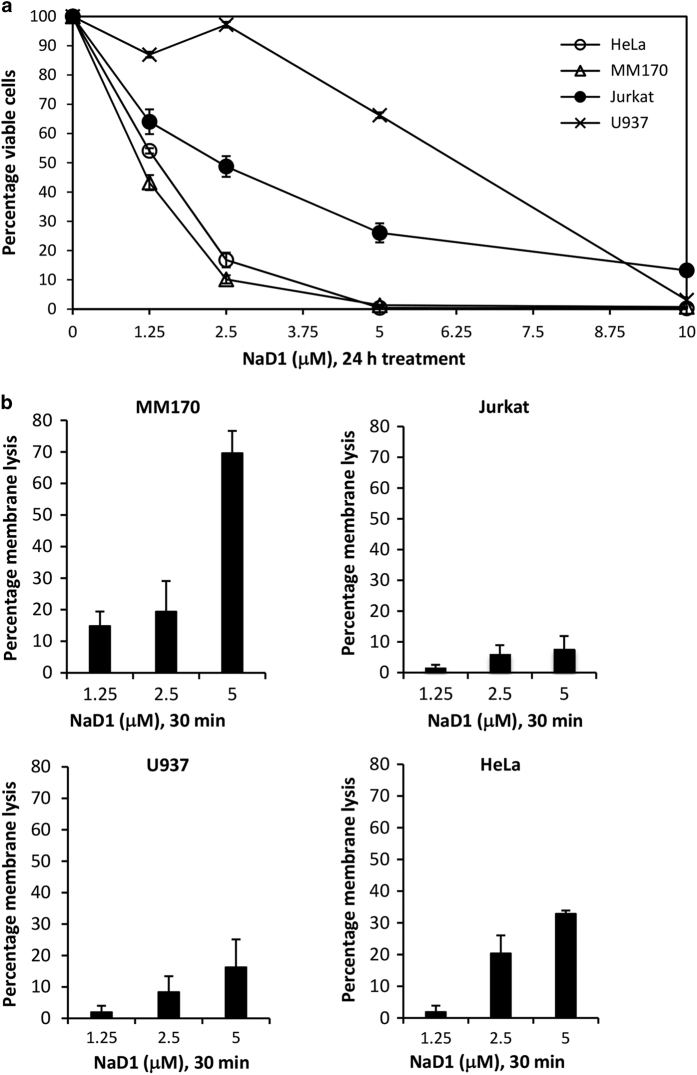
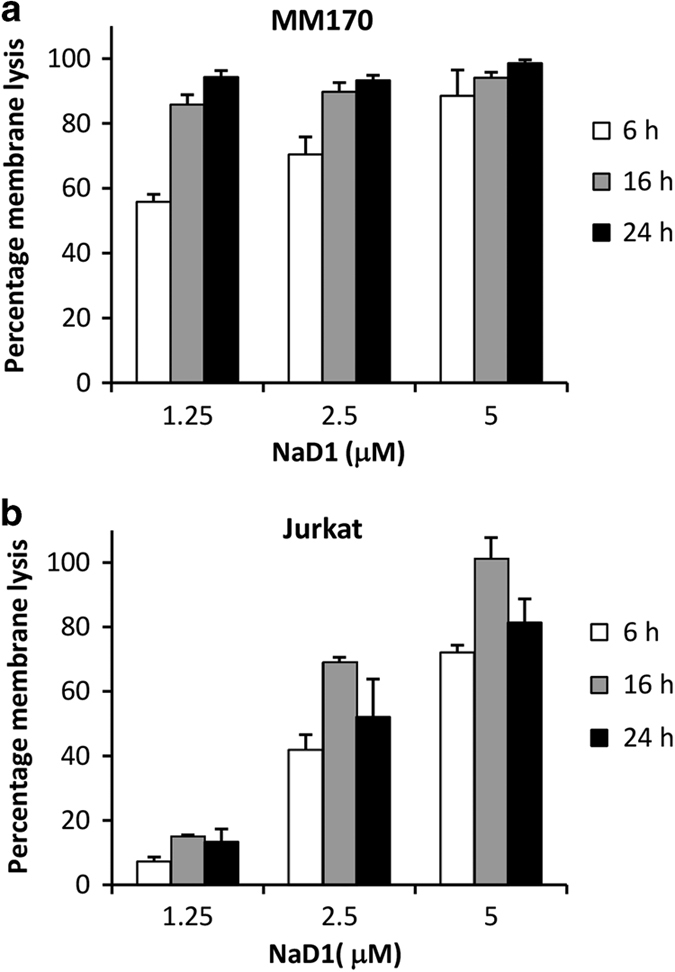
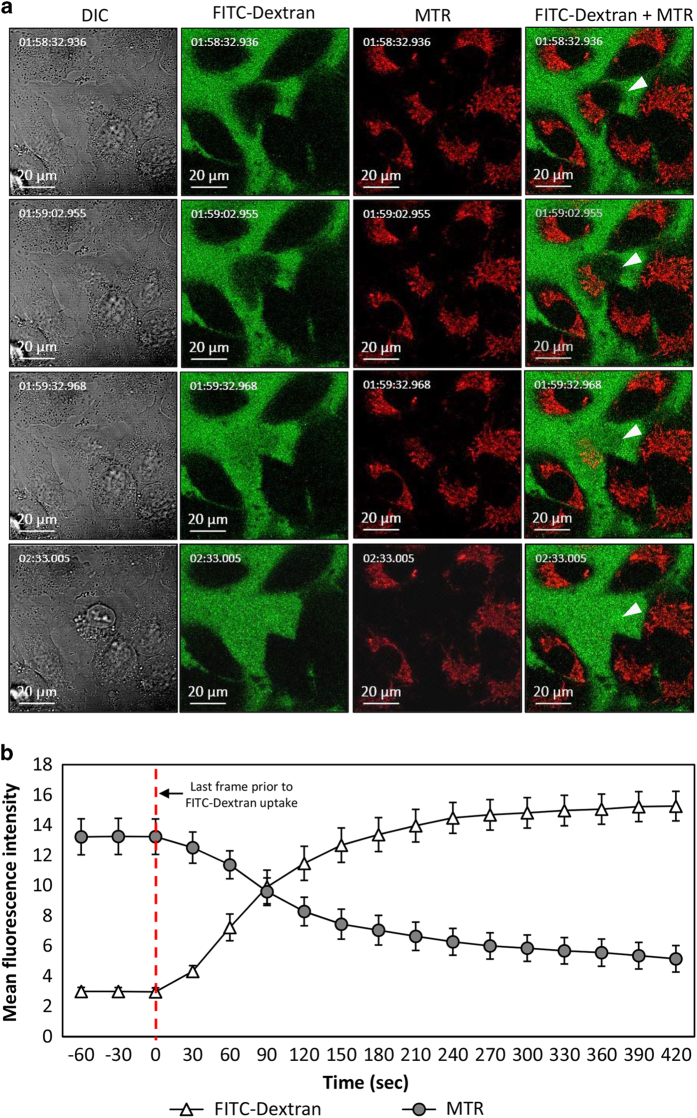
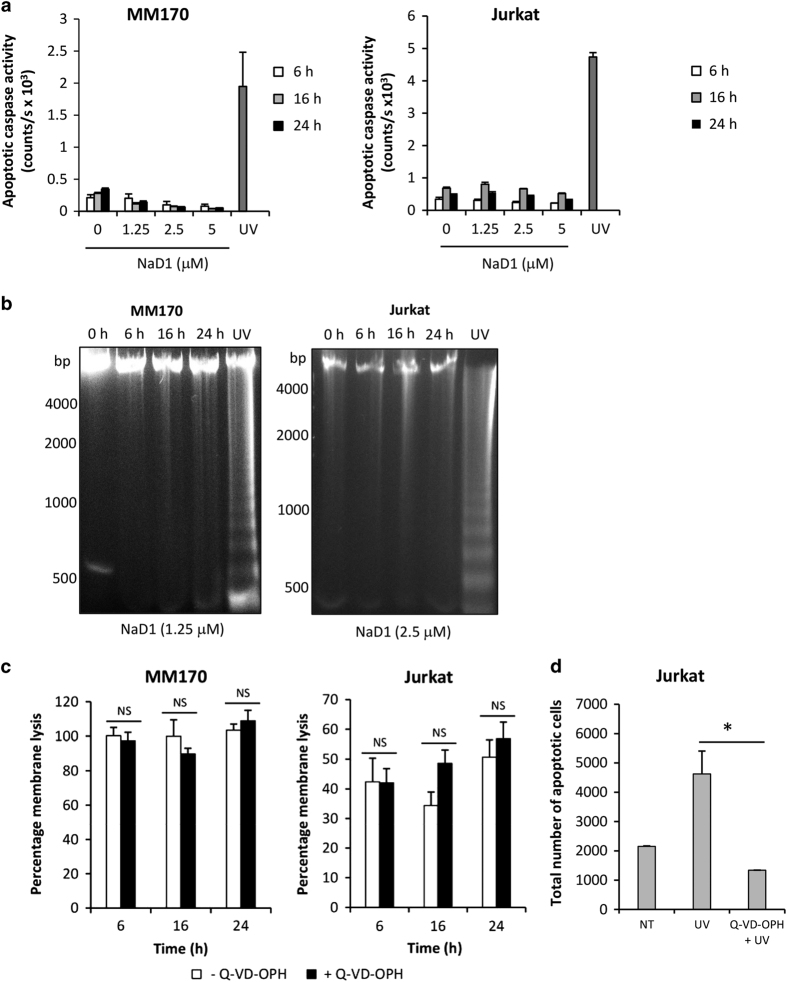
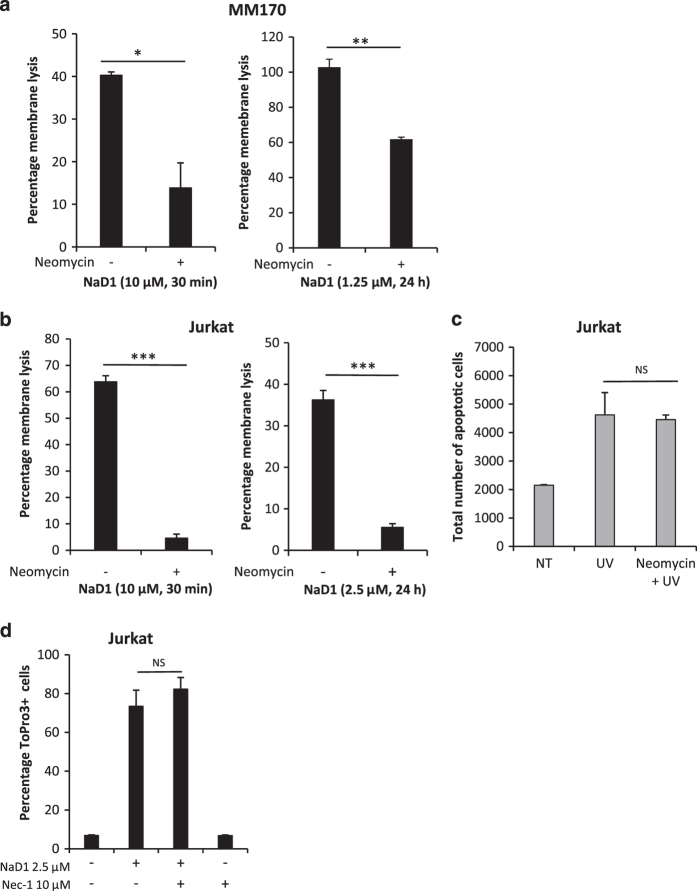
Cationic anti-microbial peptides (CAPs) have an important role in host innate defense against pathogens such as bacteria and fungi. Many CAPs including defensins also exhibit selective cytotoxic activity towards mammalian cells via both apoptotic and non-apoptotic processes, and are being investigated as potential anticancer agents. The anti-fungal plant defensin from ornamental tobacco, Nicotiana alata Defensin 1 (NaD1), was recently shown to induce necrotic-like cell death in a number of tumor cell types within 30 min of treatment, at a concentration of 10 μM. NaD1-mediated cell killing within these experimental parameters has been shown to occur via binding to the plasma membrane phosphatidylinositol 4,5-bisphosphate (PIP2) in target cells to facilitate membrane destabilization and subsequent lysis. Whether NaD1 is also capable of inducing apoptosis in tumor cells has not been reported previously. In this study, treatment of MM170 (melanoma) and Jurkat T (leukemia) cells with subacute (<10 μM) concentrations of NaD1 over 6-24 h was investigated to determine whether NaD1 could induce cell death via apoptosis. At subacute concentrations, NaD1 did not efficiently induce membrane permeabilization within 30 min, but markedly reduced cell viability over 24 h. In contrast to other CAPs that have been shown to induce apoptosis through caspase activation, dying cells were not sensitive to a pancaspase inhibitor nor did they display caspase activity or DNA fragmentation over the 24 h treatment time. Furthermore, over the 24 h period, cells exhibited necrotic phenotypes and succumbed to membrane permeabilization. These results indicate that the cytotoxic mechanism of NaD1 at subacute concentrations is membranolytic rather than apoptotic and is also likely to be mediated through a PIP2-targeting cell lytic pathway.
Figures

Similar articles
-
Phosphoinositide-mediated oligomerization of a defensin induces cell lysis.Elife. 2014 Apr 1;3:e01808. doi: 10.7554/eLife.01808. Elife. 2014. PMID: 24692446 Free PMC article.
-
The Tomato Defensin TPP3 Binds Phosphatidylinositol (4,5)-Bisphosphate via a Conserved Dimeric Cationic Grip Conformation To Mediate Cell Lysis.Mol Cell Biol. 2015 Jun 1;35(11):1964-78. doi: 10.1128/MCB.00282-15. Epub 2015 Mar 23. Mol Cell Biol. 2015. PMID: 25802281 Free PMC article.
-
Permeabilization of fungal hyphae by the plant defensin NaD1 occurs through a cell wall-dependent process.J Biol Chem. 2010 Nov 26;285(48):37513-20. doi: 10.1074/jbc.M110.134882. Epub 2010 Sep 22. J Biol Chem. 2010. PMID: 20861017 Free PMC article.
-
Nicotiana alata Defensin Chimeras Reveal Differences in the Mechanism of Fungal and Tumor Cell Killing and an Enhanced Antifungal Variant.Antimicrob Agents Chemother. 2016 Sep 23;60(10):6302-12. doi: 10.1128/AAC.01479-16. Print 2016 Oct. Antimicrob Agents Chemother. 2016. PMID: 27503651 Free PMC article.
-
Is cisplatin-induced cell death always produced by apoptosis?Mol Pharmacol. 2001 Apr;59(4):657-63. doi: 10.1124/mol.59.4.657. Mol Pharmacol. 2001. PMID: 11259608 Review.
Cited by
-
From oncolytic peptides to oncolytic polymers: A new paradigm for oncotherapy.Bioact Mater. 2023 Aug 14;31:206-230. doi: 10.1016/j.bioactmat.2023.08.007. eCollection 2024 Jan. Bioact Mater. 2023. PMID: 37637082 Free PMC article. Review.
-
Moving beyond size and phosphatidylserine exposure: evidence for a diversity of apoptotic cell-derived extracellular vesicles in vitro.J Extracell Vesicles. 2019 Apr 26;8(1):1608786. doi: 10.1080/20013078.2019.1608786. eCollection 2019. J Extracell Vesicles. 2019. PMID: 31069027 Free PMC article.
-
Modulation of Lymphocyte Potassium Channel KV1.3 by Membrane-Penetrating, Joint-Targeting Immunomodulatory Plant Defensin.ACS Pharmacol Transl Sci. 2020 May 14;3(4):720-736. doi: 10.1021/acsptsci.0c00035. eCollection 2020 Aug 14. ACS Pharmacol Transl Sci. 2020. PMID: 32832873 Free PMC article.
-
Crocodile defensin (CpoBD13) antifungal activity via pH-dependent phospholipid targeting and membrane disruption.Nat Commun. 2023 Mar 1;14(1):1170. doi: 10.1038/s41467-023-36280-y. Nat Commun. 2023. PMID: 36859344 Free PMC article.
-
A novel recombinant javanicin with dual antifungal and anti-proliferative activities.Sci Rep. 2019 Dec 5;9(1):18417. doi: 10.1038/s41598-019-55044-7. Sci Rep. 2019. PMID: 31804594 Free PMC article.
References
LinkOut - more resources
Full Text Sources
Other Literature Sources
Miscellaneous
