. 2017 Jan;6(1):88-98.
doi: 10.5966/sctm.2016-0191. Epub 2016 Aug 15.

Lacrimal Gland Repair Using Progenitor Cells

Affiliations

Lacrimal Gland Repair Using Progenitor Cells

Anastasia Gromova et al. Stem Cells Transl Med. 2017 Jan.

Abstract

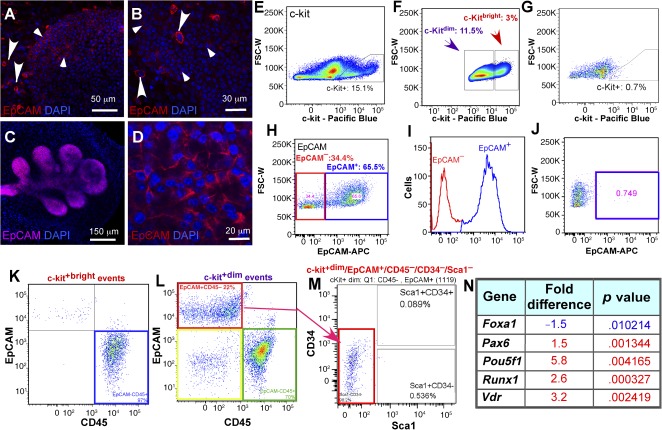
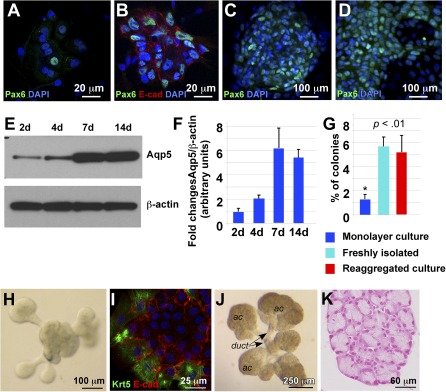
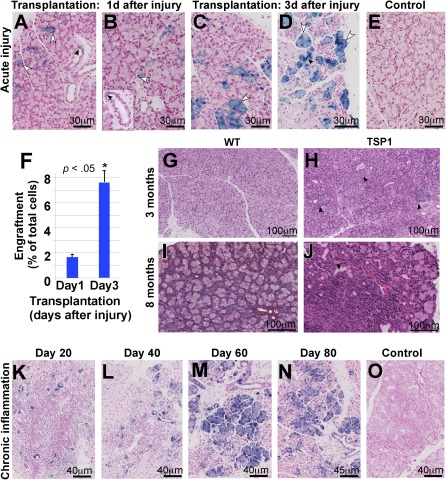
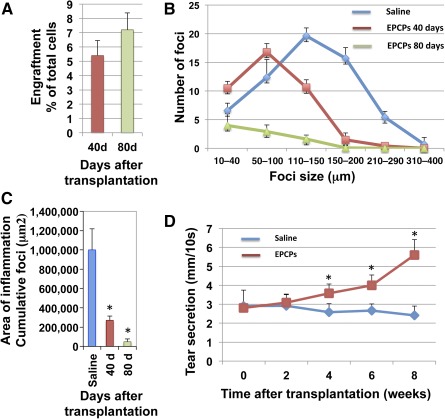
In humans, the lacrimal gland (LG) is the primary contributor to the aqueous layer of the tear film. Production of tears in insufficient quantity or of inadequate quality may lead to aqueous-deficiency dry eye (ADDE). Currently there is no cure for ADDE. The development of strategies to reliably isolate LG stem/progenitor cells from the LG tissue brings great promise for the design of cell replacement therapies for patients with ADDE. We analyzed the therapeutic potential of epithelial progenitor cells (EPCPs) isolated from adult wild-type mouse LGs by transplanting them into the LGs of TSP -1-/- mice, which represent a novel mouse model for ADDE. TSP-1-/- mice are normal at birth but progressively develop a chronic form of ocular surface disease, characterized by deterioration, inflammation, and secretory dysfunction of the lacrimal gland. Our study shows that, among c-kit-positive epithelial cell adhesion molecule (EpCAM+ ) populations sorted from mouse LGs, the c-kit+ dim/EpCAM+ /Sca1 - /CD34 - /CD45 - cells have the hallmarks of an epithelial cell progenitor population. Isolated EPCPs express pluripotency factors and markers of the epithelial cell lineage Runx1 and EpCAM, and they form acini and ducts when grown in reaggregated three-dimensional cultures. Moreover, when transplanted into injured or "diseased" LGs, they engraft into acinar and ductal compartments. EPCP-injected TSP-1-/- LGs showed reduction of cell infiltration, differentiation of the donor EPCPs within secretory acini, and substantial improvement in LG structural integrity and function. This study provides the first evidence for the effective use of adult EPCP cell transplantation to rescue LG dysfunction in a model system. Stem Cells Translational Medicine 2017;6:88-98.

Keywords: Cell culture; Cell surface markers; Cell transplantation; Cellular therapy; Fluorescence-activated cell sorting; Gene expression; Tissue-specific stem cells; c-kit.


Figures

Figure 1
Figure 1
Characterization and isolation of c‐kit‐ and EpCAM‐positive cells. (A, B): c‐kit expression (red) in embryonic (A) and adult (B) lacrimal gland (LG). (C, D): EpCam expression (red) in embryonic (C) and adult (D) LG. Large c‐kit+bright cells are seen in the mesenchyme (large arrowheads) and small c‐kit+dim cells (small arrowheads) in the epithelium (blue indicates DAPI‐stained nuclei). (E–G): Flow cytometric profile of freshly isolated c‐kit+ LG cells (E), gating of c‐kit+bright and c‐kit+dim cells (F), and isotype control antibody staining shows no labeled cells (G). (H, I): Gating of LG EpCAM+ cells (H, I: red square in H and red peak in I are EpCAM cells; blue square in H and blue peak in I are EpCAM+ cells). (J): Isotype control antibody staining shows no labeled cells (blue square). (K): Gating the c‐kit+bright cells: all c‐kit+bright cells are EpCAM/CD45+ (blue square). (L): Gating of c‐kit+dim/EpCAM+/CD45 cells. C‐kit+dim events: red square, c‐kit+dim/EpCAM+/CD45 cells, 22%; green square, kit+dim/EpCAM/CD45+ cells, 70%; yellow square, kit+dim/EpCAM/CD45 cells, less than 8%. (M): Gating and isolation of epithelial progenitor cell (EPCP) (c‐kit+dim/EpCAM+/CD45 /CD34/Sca1 red square). (N): Putative EPCPs express stem cell markers. Gene expression in sorted EPCPs (c‐kit+dim/EpCAM+ cells) were compared with isolated c‐kit/EpCAM+ epithelial cells using a RT2 First Strand Kit (catalog no. 330401; SABiosciences, Qiagen) and applied to The Mouse Stem Cell Transcription Factors RT2 Profiler Array. Only genes changed 1.5‐fold with significantly different expression levels (p < .01) are shown. Statistical analysis was performed by using real‐time polymerase chain reaction data from three independent RNA preparations. Abbreviations: DAPI, 4′,6‐diamidino‐2‐phenylindole; EpCAM, epithelial cell adhesion molecule; FSC‐W, forward scatter pulse width.
Figure 2
Figure 2
Differentiation of lacrimal gland (LG) epithelial cells in monolayer culture. (A–D): One day (A), 1 week (B, C), and 3 weeks (D). (A–D): Cultured cells were stained with antibody to Pax6 (green). (B): Cells were stained with antibodies to Pax6 (green) and E‐Cadherin (red). Nuclei are stained with DAPI (blue). (E): Western blot showing expression of aquaporin‐5 (Aqp5) in fluorescence‐activated cell sorting‐isolated epithelial progenitor cells (EPCPs) cultured for 2, 4, 7, and 14 days. (F): Quantification of protein abundance as measured from immunoblot band intensities (e.g., E) in three independent experiments. Values represent the optical density of Aqp5 bands normalized to that of β‐actin bands (means of three experiments ± SD). (G): Comparison of colony forming abilities (using an in vitro colony forming efficiency [CFE] assay) of EPCPs grown in monolayer, freshly isolated EPCPs, and EPCPs grown in three‐dimensional (3D) reaggregated cultures. The CFE was calculated as the number of colonies at day 8 as a proportion of the number of cells plated in a well. In each experiment, six replicate wells were analyzed per each experimental condition. The final CFE was calculated in three independent experiments (i.e., a total of 18 wells per each condition). p value was determined versus control (freshly isolated EPCPs). Asterisk indicates significant differences between monolayer cultures and freshly isolated or reaggregated cultures: *, p < .01. (H): EPCPs grown in 3D reaggregated culture form buds in 24–48 hours. (I): Buds express Krt5 (green) and E‐cadherin (red). (J): LG reaggregates cultured for 1 week differentiate into ductal and acinar components. (K): Transverse section of one of the acinar components of the 3D reaggregated culture showing acinar structure. Section was stained with Fast red to visualize nuclei. Abbreviations: ac, acinar; DAPI, 4′,6‐diamidino‐2‐phenylindole; duct, ductal; E‐cad, E‐cadherin.
Figure 3
Figure 3
Epithelial progenitor cell (EPCP) transplantation in models of acute and chronic lacrimal gland (LG) inflammation. (A–D): Donor EPCPs (LacZ+) injected into host LG 1 day (A, B) and 3 days (C, D) after the interleukin‐1α injury engraft into the recipient's LGs. LG were analyzed 40 days after the transplantation. LacZ+ cells are found in acinar (white arrowheads) and ductal compartments (black arrowheads). (E): Control (injected with the vehicle) shows no LacZ cells. All sections are costained with Fast Red to visualize nuclei. (F): Quantification of EPCP engraftment into recipient's injured LG 40 days after EPCP cell transplantation. Engraftment of cells injected 3 days after the injury is more efficient than engraftment of cells transplanted 1 day after the injury. Engraftment was determined as a percent of the ratio between LacZ+ and LacZ cells. Eight LGs per each time point were analyzed in three independent experiments. Asterisk indicates significant differences in cell engraftment between transplantations performed on days 1 and 3 after LG injury; *, p < .05. (G–J): TSP‐1−/− mice progressively develop a severe inflammation in the LG. LG of 3‐month‐old (G) and 8‐month‐old (I) WT mice show normal acinar structure, whereas the LG of 3‐month‐old TSP‐1−/− mice show numerous periductal cell infiltrates (H, black arrows) and by 8 months TSP‐1−/− mice develop severe LG inflammation (J, black arrows indicate large inflammation foci). (G, H): H&E is shown. (I, J): Trichrome staining is shown. (K–O): Engraftment of LacZ+ EPCPs into chronically inflamed LG of 8‐month‐old TSP‐1−/− mice: analysis of cell engraftment was performed 20 (K), 40 (L), 60 (M), and 80 (N) days after cell transplantation. (O): Negative control, saline‐injected LG. Abbreviation: WT, wild‐type.
Figure 4
Figure 4
EPCP transplantation improves lacrimal gland (LG) structure and function. (A): Analysis of EPCP engraftment into “diseased” LG of 8‐month‐old TSP‐1−/− mice 40 and 80 days after cell transplantation. A total of 180 sections from 12 EPCP‐injected and 12 control LGs were analyzed per each time point. (B): Transplantation of EPCPs decreases inflammation of host (8‐month‐old TSP‐1−/−) LG with advanced stage aqueous‐deficiency dry eye. The data are mean number of inflammatory foci ± SD from four or five mice. Statistical significance of differences between groups was calculated by using a two‐tailed t test for groups with unequal variance and gave the following p values: saline‐injected versus EPCP‐injected (60 days after injection), p = 1.05658530891 × 10⁸; saline‐injected versus EPCP‐injected (80 days after injection), p = 2.53814392935 × 10¹⁴; EPCP‐injected (60 days after injection) versus EPCP‐injected (80 days after injection), p = 7.56001815449 × 10¹¹. (C): Total area of inflammation (cumulative foci [μm2]) in TSP‐1−/− mouse LG decreases after EPCP transplantation (area of inflammation was calculated at 40 and 80 days after EPCP transplantation in three independent experiments, with four animals per condition in each experiment). In all experiments shown in A–C, 180 sections from 12 EPCP‐injected and 180 sections from 12 control saline‐injected LGs were analyzed per each time point. Asterisks indicate significant differences in size of area of inflammation (measured in mm2) between saline‐ and EPCP‐injected LGs; *, p < .05. (D): Animals (8‐month‐old TSP‐1−/− mice) that received a single injection of EPCPs showed a significant increase in tear production at 4 weeks after transplantation. Tear production was measured in 18 mice per each time point and each condition in three independent experiments (six mice per experiment). The two‐tailed Fisher's exact test was used to identify significant differences between the mean values of experimental and control groups for each time point. The p values for each time point were as follows: 0 weeks (p = 1), 2 weeks (p = 1), 4 weeks (p = .06), 6 weeks (p = .0002), and 8 weeks (p = .002). Asterisks indicate differences in tear production between day 0 and weeks 4, 5, and 6 after EPCP transplantations; *, p values are determined in the text above. Abbreviation: EPCPs, epithelial progenitor cells.

Similar articles

Cited by

References

    1. Kourembanas S. Stem cell‐based therapy for newborn lung and brain injury: Feasible, safe, and the next therapeutic breakthrough?. J Pediatr 2014;164:954–956. - PubMed
    1. Xu J, Qu J, Cao L et al. Mesenchymal stem cell‐based angiopoietin‐1 gene therapy for acute lung injury induced by lipopolysaccharide in mice. J Pathol 2008;214:472–481. - PubMed
    1. Buzhor E, Leshansky L, Blumenthal J et al. Cell‐based therapy approaches: The hope for incurable diseases. Regen Med 2014;9:649–672. - PubMed
    1. Li WC, Rukstalis JM, Nishimura W et al. Activation of pancreatic‐duct‐derived progenitor cells during pancreas regeneration in adult rats. J Cell Sci 2010;123:2792–2802. - PMC - PubMed
    1. Burgess KL, Dardick I, Cummins MM et al. Myoepithelial cells actively proliferate during atrophy of rat parotid gland. Oral Surg Oral Med Oral Pathol Oral Radiol Endod 1996;82:674–680. - PubMed

Publication types

MeSH terms

Substances