Review
. 2017 Jun 22;60(12):4735-4779.
doi: 10.1021/acs.jmedchem.6b01309. Epub 2017 Mar 10.

Structural Analysis of Chemokine Receptor-Ligand Interactions

Affiliations
Review

Structural Analysis of Chemokine Receptor-Ligand Interactions

Marta Arimont et al. J Med Chem. .

Abstract

This review focuses on the construction and application of structural chemokine receptor models for the elucidation of molecular determinants of chemokine receptor modulation and the structure-based discovery and design of chemokine receptor ligands. A comparative analysis of ligand binding pockets in chemokine receptors is presented, including a detailed description of the CXCR4, CCR2, CCR5, CCR9, and US28 X-ray structures, and their implication for modeling molecular interactions of chemokine receptors with small-molecule ligands, peptide ligands, and large antibodies and chemokines. These studies demonstrate how the integration of new structural information on chemokine receptors with extensive structure-activity relationship and site-directed mutagenesis data facilitates the prediction of the structure of chemokine receptor-ligand complexes that have not been crystallized. Finally, a review of structure-based ligand discovery and design studies based on chemokine receptor crystal structures and homology models illustrates the possibilities and challenges to find novel ligands for chemokine receptors.


Conflict of interest statement

The authors declare no competing financial interest.

Figures

Figure 1
Figure 1
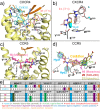
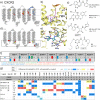
Chemokine receptor X-ray structures. (a) Alignment of 31 (PDB 3ODU; pink spheres), CVX15 (PDB 3OE0; cyan spheres), and (b) vMIP-II (PDB 4RWS; dark-green cartoon and spheres) bound CXCR4 crystal structures. The receptor is colored for a better interpretation: 3ODU in light yellow, 3OE0 in gray. TM helices align well in the three different reported structures with subtle differences: TM1 is one turn longer (R30N-ter–N33N-ter) and laterally shifted outward in the vMIP-II bound CXCR4 structure, TM6 is half turn shorter in the 31 bound CXCR4 structure (H2326.28–Q2336.29), helix 8 is missing in all the structures, and the C-terminus has only been solved for the 31 bound CXCR4 structure (A307C-ter–S319C-ter). vMIP-II targets both the chemokine recognition site 1 (CRS1, comprising the N-terminus and extracellular loops of the receptor) and the chemokine recognition site 2 (CRS2, including the TM domain binding site) of CXCR4, consistent with the two-step binding model. (c) An active conformation of US28, a viral chemokine-like receptor, binding the human CX3CL1 chemokine in the extracellular binding site, and a nanobody (Nb7, purple cartoon) in the intracellular binding site (PDB 4XT1; green cartoon and spheres). Both chemokines vMIP-II (a) and CX3CL1 (c) are shown as spheres on their N-terminus coils, and their globular cores are shown as a cartoon for a better visualization of their secondary structure. (d) CCR5 crystal structure bound to the small ligand 16 (PDB 4MBS; magenta spheres), occupying both the transmembrane site 1 (TMS1), also known as small pocket, and transmembrane site 2 (TMS2), or major pocket. (e) CCR9 crystal structure bound to the small allosteric antagonist 30 (PDB 5LWE, dark-cyan spheres) targeting an intracellular allosteric intracellular pocket and thereby blocking G-protein coupling. (f) CCR2 crystal structure bound to the orthosteric antagonist 58 (orange spheres) and the allosteric antagonist 29 (lime spheres) targeting an intracellular binding pocket (PDB 5T1A(15)). (g) Summary of interactions observed in the CXCR4, CCR5, US28, CCR2, and CCR9 crystal structures. The background of the amino acid residue positions is colored according to the different binding site regions (defined in panel a), amino acid residues involved in receptor–ligand interactions are depicted in bold and colored according to the cocrystallized ligand with which they interact. More detailed analyses of the structural receptor–ligand interactions are provided in Figures 3–5. Two-dimensional representations of the chemical structures of the small-molecule ligands 16, 29, 30, 31, and 58 are provided in Figures 11–13
Figure 2
Figure 2
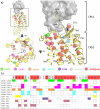
Structure-based sequence alignment (in line with GPCRdb) of chemokine receptors for which crystal structure and/or site-directed mutagenesis information on small-molecule ligand binding is available (described in sections 2–5), including CCR1,, CCR2,,, CCR5, CCR8, CCR9, CXCR2, CXCR3, CXCR4,,− and US28. Amino acid residues in CXCR4, CCR2, CCR5, CCR9, and US28 that are involved in receptor–ligand interactions are highlighted in bold and colored corresponding to the cocrystallized ligands 29 and 58 (in CCR2), 16 (CCR5), 30 (CCR9), 31, CVX15 and vMIP-II (CXCR4), and CX3CL1 and Nb7 (US28) according to the color coding in Figure 1. More detailed analyses of the structural receptor–ligand interactions are provided in Figures 3–5. Two-dimensional representations of the chemical structures of the small-molecule ligands 16, 29, 30, 31, and 58 are provided in Figures 11–13. The background of residues for which site-directed mutagenesis data have been reported is marked gray.
Figure 3
Figure 3
(a) Detailed comparison of the binding modes of 31 (PDB 3ODU) and CVX15 (PDB 3OE0) in CXCR4 crystal structures. The small-molecule antagonist 31 (pink carbon atoms) binds the minor binding pocket (TMS1) of CXCR4, whereas the peptide antagonist CVX15 (cyan) mainly targets in the major binding pocket (TMS2). (b) Three-dimensional quantitative structure–activity relationship (3D-QSAR) model of 13 analogues of CXCR4 antagonist 31(78) constructed using FLAP, based on an alignment to the cocrystallized pose of 31 in CXCR4, indicating that a hydrophobic interaction field between the methyl groups of the imidazothiazole ring system (cyan surface) and the six-membered ring is an important determinant for binding the minor binding pocket of CXCR4. (c) Detailed analysis of the binding mode of 16 (magenta carbon atoms) targeting both the minor and the major binding pockets in the CCR5 crystal structure (PDB 4MBS). (d) Ligand-based pharmacophore model of some of the most representative CCR5 small ligands 16,20 (TAK-220), and 21 (Aplaviroc), including four pharmacophore features: two apolar/hydrophobic moieties (Hyd1, Hyd2), a hydrogen bond acceptor/cationic feature (Cat&Don), and an aromatic (Aro) feature. The residues corresponding to the 16 bound CCR5 crystal structure potentially interacting with the model are shown as gray sticks. (e) Comparative structural interaction fingerprint (IFP) analysis of the binding modes of 31 and CVX15 in CXCR4 and 16, 20, and 21 in CCR5, presented in panels a, c, and d. The structural receptor–ligand interaction patterns are described by IFP bit strings encoding different interaction types between the ligand and the different CXCR4/CCR5 amino acid residues. Two-dimensional representations of the chemical structures of the small-molecule ligands 16, 20, 21, and 31 are provided in Figures 11,12.
Figure 4
Figure 4
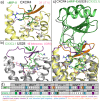
Details of chemokine binding to CXCR4 (PDB 4RWS(13)) and US28 (PDB 4XT1(14)). (a) vMIP-II N-terminus binding to CXCR4 (pale yellow). The N-terminus of vMIP-II (dark-green sticks) binds primarily in the minor pocket that is also targeted by 31 (transparent pink sticks), interacting with W942.60, D972.63, and E2887.39 but also partially binds the major binding site, interacting with D2626.58. (b) CX3CL1 N-terminus (light green sticks) binding to US28 (gray). CX3CL1 N-terminus, as well as vMIP-II, binds mainly in the small binding site, interacting with Y401.39, T17545.52, and E2777.39 but also partially occupies the major binding site. CCR5 antagonist 16 is shown as transparent magenta sticks as reference. (c) vMIP-II (dark green) and CX3CL1 (green) superimposition. The overall architecture is conserved: the N-terminus inside the TM domain and the core to the extracellular surface (CRS1). (d) Comparative structural interaction fingerprint (IFP) analysis of the binding modes of vMIP in CXCR4, and CX3CL in US28, presented in panels a–c. The structural receptor–ligand interaction patterns are described by IFP bit strings encoding different interaction types between the ligand and the different CXCR4/US28 amino acid residues. Two-dimensional representations of the chemical structures of the small-molecule ligands 16 and 31 are presented in Figures 11, 12
Figure 5
Figure 5
Details of small ligand binding to CCR2 (PDB 5T1A(15)) and CCR9 (PDB 5LWE(16)). (a) Structural interactions between the orthosteric antagonist 58 (orange sticks) and the minor binding pocket of CCR2. CXCR4 antagonist 31 (pink sticks) is shown transparent as reference. (b) Structural interactions between the allosteric antagonist 29 (lime sticks) and the allosteric intracellular pocket of CCR2. Residues from the G-protein in the G-protein bound ADRB2 structure are shown in transparent orange sticks as reference. (c) Structural interactions between the allosteric antagonist 30 (dark-cyan sticks) and the intracellular allosteric pocket of CCR9. Residues from the G-protein in the G-protein bound ADRB2 structure are shown in transparent orange sticks as reference. (d) Comparative structural interaction fingerprint (IFP) analysis of the binding modes of 58 and 29 in CCR2, and 30 in CCR9, presented in panels a–c. The structural receptor–ligand interaction patterns are described by IFP bit strings encoding different interaction types between the ligand and the different CCR2/CCR9 amino acid residues. Two-dimensional representations of the chemical structures of the small-molecule ligands 29, 30, 31, and 58 are provided in Figure 13.
Figure 6
Figure 6
Structural changes associated with the active state of class A GPCRs. (a) Conformational changes from an inactive conformation (CCR5, transparent gray cartoon, PDB 4MBS(12)) to an active-like conformation (US28, yellow cartoon, PDB 4XT1(14)). (b–d) Conformational changes from an active-like conformation (US28, yellow cartoon) to a fully active conformation (beta 2 adrenergic receptor, transparent cyan cartoon, PDB 3SN6; A2A adenosine receptor, transparent limegreen cartoon, PDB 5G53; rhodopsin, transparent violet cartoon, PDB 4ZWJ(89)). Gs protein (orange), mini Gs protein (pink), and arrestin (blue) are shown in transparent cartoon for a better visualization. The structural alignments reveal an outward position of TM6 (red arrows), a lateral shift of TM5, and an inward movement of TM7 in the active-like conformation of US28 in comparison to the inactive conformation of CCR5. The outward shift of TM6 is significantly bigger for beta 2AR, A2a, and rhodopsin receptors. R3.50 of the DRY motif and Y7.53 of the NPxxY motif are shown as sticks as reference: in an active-like conformation, as well as in the full active conformations, the side chains of both residues are pointing toward the center of the TM bundle, while in the inactive conformation they are not.
Figure 7
Figure 7
Binding details of cocrystallized Nb7 (a, purple, PDB 4XT1(14)) and intracellular effectors (b, Gs, orange, PDB 3SN6; c, mini-Gs, pink, PDB 5G53; d, beta-arrestin, blue, PDB 4ZWJ(89)). The side chains of residues interacting with the intracellular binders and the residues of the two important motifs stabilizing the active conformation (DRY and NPxxY) are shown as sticks. (b) Structural interaction fingerprint (IFP) analysis of the binding mode of the intracellular binders presented in panels a–d. The structural receptor–ligand interaction patterns are described by IFP bit strings encoding different interaction types between Nb7 and the different US28 amino acid residues.
Figure 8
Figure 8
Molecular determinants of chemokine binding supported by site-directed mutagenesis data.,,,−,−,,,,,,,,,,,, (a) 3D representation of the reported receptor residues involved in chemokine binding. (b) Summary of the determinants of receptor:chemokine binding. Mutated positions that significantly decrease the binding of the chemokine are colored as follows: green for CXCR1, magenta for CXCR3, orange for CXCR4, yellow for CCR2, purple for CCR3, and blue for CCR5. Mutations of positions that affect the binding of more than one receptor:chemokine pair (multiple) are colored in gray, and those positions that when mutated affect the binding of some receptor:chemokine pairs but not other pairs (ambiguous), are colored in red. Those positions that have been mutated but do not decrease the binding of the chemokine are not colored, but squared.
Figure 9
Figure 9
Insights into chemokine structure–activity relationships based on X-ray crystal structures, NMR structures, and site-directed mutagenesis studies. (a) Structural alignment of X-ray structures and NMR structures of: CXCL8 (turquoise, PDB 1ILQ(17)), CXCL12 (purple, PDB 3GV3; light green and orange, PDB 2J7Z(141)), vMIP-II (pink, PDB 4RWS(13)), CCL5 (blue, PDB 1U4M(142)), and CX3CL1 (yellow, PDB 4XT1(14)). The main structural motifs are conserved (including the C-terminal α helix, the three antiparallel beta strands, and the 310 turn), but the N-terminus of the different chemokines adopts many different conformations, usually pointing, however, in the TM domain direction. (b) NMR models structure superimposition of the CXCR4 N-terminus (pale yellow) binding CXCL12 (light green), and CXCR1 N-terminus (orange) binding CXCL8 (turquoise). The structural alignment shows that the N-terminal regions of the chemokines adopt have different orientations with respect to the conserved chemokine core region. The C-terminal residue side chain of the N-terminus is shown as sticks for a better interpretation (P17N-ter for CXCR1, K381.32 for CXCR4). The Cα atoms of three of the conserved cysteine residues in both chemokines are shown as spheres. (c) Engineered I-body scaffold based in human neural cell adhesion molecule (NCAM) immunoglobulin domain 1. Complementarity determining-like binding regions 1 and 3 (CDR1 and CDR3) are colored in yellow and red, respectively. In CDR1, Ala28 is shown as sticks, which corresponds with the position of a conserved arginine in the derivatives. CDR3 is variable in length for each i-body and also contains different highly conserved arginines. (d) Chemokines sequence alignment. Differences between the pIC50, pKd, or pEC50 values of wild-type and mutant <−0.5 (cyan), −0.5 to 0.5 (blue), 0.5 to 1.0 (yellow), and >1.0 (red) log units for chemokines are reported and color coded (annotated data set included in Supporting Information).,,,, The secondary structure motifs are indicated in boxes. Residues of vMIP-II and CX3CL1 interacting with the receptors CXCR4 and US28 respectively in the corresponding crystal structures are highlighted in bold gold. The aligned cysteines involved in the disulfide bridges that stabilize the chemokine tertiary structure are surrounded by a blue box. The first CXCL8 residues in a gray background correspond to an alternative but minority isoform also active in physiological conditions.
Figure 10
Figure 10
CXCL12 binding to CXCR4 based on site-directed mutagenesis assays. Differences between the pIC50a, pKdb, or pEC50c values of wild-type and mutant <−0.5 (cyan), −0.5 to 0.5 (blue), 0.5 to 1.0 (yellow), and >1.0 (red) logarithmic units are reported for 90 CXCR4 mutant-CXCL12 combinations covering 42 residues (annotated mutation data set included in Supporting Information).,,,,,, Maximum mutation effects are mapped on: (a) CXCL12 (green) bound CXCR4 structure (modeled based on the vMIP-II bound CXCR4 crystal structure (PDB 4RWS), and (b) CXCR4 snakeplot adapted from GPCRdb. Residues involved in ligand interactions for the vMIP bound CXCR4 crystal structure are encircled in green. Effects on CXCL12 affinity and potency are annotated by background and amino acid color, respectively. Mutation data derived from antibodies inhibition binding is not shown. (c) Summary of CXCR4 site-directed mutagenesis effects on CXCL12 binding/potency in individual studies. A recent study has been published reporting single-point binding and functional data of all CXCR4 residues mutants, which has indicated that in particular W942.60 and D972.63 are critical for CXCL12-mediated signaling.
Figure 11
Figure 11
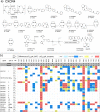
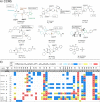
(a) Chemical structures of CXCR4 ligands investigated in CXCR4 mutation studies.,− Interactions between the ligands and specific residues derived from CXCR4 X-ray structures (bold), mutation studies (gray), or models without support from experimental data (gray italics) are depicted by dotted lines. (b) Differences between the pIC50a or pKib values of wild-type and mutant <−0.5 (cyan), −0.5 to 0.5 (blue), 0.5 to 1.0 (yellow), and >1.0 (red) logarithmic units are reported for 276 CXCR4 mutant–ligand combinations covering ligands 115 and 33 CXCR4 mutants (annotated mutation data set included in Supporting Information).
Figure 12
Figure 12
(a) Chemical structures of CCR5 ligands with related mutation data. Interactions between the ligands and specific residues derived from CCR5 X-ray structures (bold), mutation studies (gray), or models without support from experimental data (gray italics) are depicted by dotted lines. (b) Affinities from site-directed mutagenesis studies on chemokine receptors. Differences between the pIC50a, pKib, or pKdc values of wild-type and mutant <−0.5 (cyan), −0.5 to 0.5 (blue), 0.5 to 1.0 (yellow), and >1.0 (red) logarithmic units are reported for 217 CCR5 mutant–ligand combinations covering ligands 1624 and 38 CCR5 mutants (annotated mutation data set included in Supporting Information).
Figure 13
Figure 13
(a) Chemical structures of CCR2,, and CCR9 ligands with related mutation data. Interactions between the ligands and specific residues derived from CCR5 X-ray structures (bold), mutation studies (gray), or models without support from experimental data (gray italics) are depicted by dotted lines. (b) Affinities from site-directed mutagenesis studies on chemokine receptors. Differences between the pIC50a, pKib, or pKdc values of wild-type and mutant <−0.5 (cyan), −0.5 to 0.5 (blue), 0.5 to 1.0 (yellow), and >1.0 (red) logarithmic units are reported for 57 CCR2 mutant–ligand combinations covering ligands 19, 2529, and 18 mutants, and five CCR9 mutants on ligand 30 (annotated mutation data set included in Supporting Information).
Figure 14
Figure 14
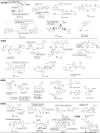
Summary of structure–activity relationship (SAR) of CXCR4, CCR2, CCR5, CCR9, and US28 ligands. The representative CXCR4 ligands include compounds 31,32,3334,,35,,36, and 37; CCR5 ligands include compounds, 38,39,40,41,42,43, and 44. US28 ligands include compounds 45,46, 47,48,49,50,51, and 52. CCR2 ligands include compounds 53,54,55,56,57, 58,59, and CCR9 ligands 60. Interactions between the ligands and specific residues derived from X-ray structures (bold), mutation studies (gray), or models without support from experimental data (gray italics) are depicted by a dotted line, interacting groups are surrounded by a dotted line, and key features are summarized by a solid box. Mutation data for the US28 ligand 45(145) is also included in a squared box. For each ligand, the binding affinity (IC50, Kd, Ki) or potency (EC50, IC90) is reported (except for compound 35, for which functional IC50 is reported, and for compound 60Ki is based on MOLT-4 cells).
Figure 15
Figure 15
General GPCR molecular modeling workflow with specific details in chemokine receptor modeling customization and applications. For each step, specific details from experimental and in silico data concerning the target to model may be used to improve the approach. The left panel shows specific details on chemokine receptors modeling, including considerations in length, conserved residues (represented in orange), or conserved motifs (represented in pink) that can influence the orientation of specific residues in or out of the binding site (colored in green). The right panel summarizes the applicability domains of the structural models generated along the modeling workflow, ranging from the design of SAR and mutation studies and the generation of ligand repurposing hypotheses based on crystal structure-based sequence alignments, the identification of ligand binding sites, elucidation of ligand binding modes, and the application of structural models for structure-based virtual screening, structure-based ligand design, and the elucidation of ligand-mediated receptor activation mechanisms.
Figure 16
Figure 16
(a) Chemokine receptors binding site alignment, (b,d) amino acid sequence similarity and identitity matrices based on alignments of (b) TM helices (TM1- TM7) and ECL2 and (d) binding sites, and (c) binding site sequence similarity based clustering of 23 human chemokine receptors (CCR1, CCR2, CCR3, CCR4, CCR5, CCR6, CCR7, CCR8, CCR8, CCR9, CCR10, CXCR1, CXCR2, CXCR3, CXCR4, CXCR5, CXCR6, CX3CR1, XCR1, ACKR1, ACKR2, ACKR3/CXCR7, ACKR4, and CCRL2) and viral chemokine receptor US28 (calculated using GPCRdb). The residues selected for the binding site alignment, sequence similarity/identity calculations, and clustering include TM1 (1.35, 1.39), TM2 (2.53, 2.60, 2.63), TM3 (3.29, 3.32, 3.33, 3.36, 3.37), TM4 (4.57, 4.60), TM5 (5.32, 5.35, 5.39, 5.42, 5.46), TM6 (6.48, 6.51, 6.52, 6.55, 6.58, 6.59), TM7 (7.32, 7.35, 7.36, 7.39, 7.43, 7.45), and ECL2 (45.50, 45.51, 45.52). Binding site residue Cα atoms are depicted as spheres in panel c and colored according to binding site region (see panel a). Pairwise sequence similarity (lower-left) and identity (upper right) percentages are reported based on sequence alignment of (b) TM helices and (d) binding sites and are gradually color-coded from red to green. Cells surrounded by black squares correspond to data described in the text. Chemokine receptor binding site based clustering (c) has been performed based on the UPGMA algorithm with 100 replicas of bootstrapping (calculated using GPCRdb).
Figure 17
Figure 17
Optimization and evaluation of molecular docking based binding mode prediction studies of compound 13 in CXCR4 using on site-directed mutagenesis and SAR,, data. (a) Docking pose of 13 in the binding pocket of the 31 bound CXCR4 crystal structure, (c) docking pose in the binding pocket of the CVX15 bound CXCR4 crystal structure, (e) optimized docking pose based on mutation and SAR data. (d) Effects of CXCR4 mutations on the binding affinity of 13, mapped on a helical box diagram (adapted from GPCRdb). Note that (i) the mutational effect of D2626.58 (see Figure 11b) is not shown, and (ii) that the helical box of TM2 does not reflect the T2.56XP2.58 kink of chemokine receptors, depicting the residues of 2.60 and 2.63 toward the membrane surface while they are in fact pointing toward the TM binding site. Differences between the pKi values of wild-type and mutant <−0.5 (cyan), −0.5 to 0.5 (blue), 0.5 to 1.0 (yellow), and >1.0 (red) are reported in logarithmic units (annotated data set included in Supporting Information). (d) Summary of structure–activity relationships of analogues of 13. The interactions with key residues derived from mutation studies (gray background) are depicted by a gray dotted line. (f) Comparative structural interaction fingerprint (IFP) analysis of the different binding modes of 13 in CXCR4 presented in panels a, c, and e. The structural receptor–ligand interaction patterns are described by IFP bit strings encoding different interaction types between 13 and the amino acid residues of CXCR4.
Figure 18
Figure 18
CXCR2 ligand binding model predictions based on molecular docking and site-directed mutagenesis assays. (a,d) CXCR2 snakeplots (adapted from GPCRdb) summarizing the effects of mutation effects on affinity/potency of (a) 64 (imidazolylpirimidine) and (d) 63, suggesting that 64 and 63 target extracellular and intracellular binding sites of CXCR2, respectively (indicated by dotted boxes). (b,e) Structural details of the predicted binding modes of (b) 64 (pink) and (e) 63 (turquoise). (c) Chemical structures of CXCR2 ligands that have been investigated in mutation studies. Interactions between the ligands and specific residues derived from X-ray structures (bold), mutation studies (gray), or models without support from experimental data (gray italics) are depicted by dotted lines. (f) Comparative structural interaction fingerprint (IFP) analysis of the predicted binding modes of 64 and 63 in CXCR2 presented in panels b and e. The structural receptor–ligand interaction patterns are described by IFP bit strings encoding different interaction types between the ligand and the different CXCR2 amino acid residues. (g) Differences between the pKia, pKdb, or pEC50c values of wild-type and mutant <−0.5 (cyan), −0.5 to 0.5 (blue), 0.5 to 1.0 (yellow), and >1.0 (red) logarithmic units are reported for 76 CXCR2 mutant–ligand combinations covering ligands 6164, CXCL8, CXCL1, and 28 CXCR2 mutants (annotated data set included in Supporting Information).
Figure 19
Figure 19
CXCR3 ligand binding models based on molecular docking and site-directed mutagenesis studies. (a) Chemical structures of CXCR3 ligands with mutation data. Interactions between the ligands and specific residues derived from X-ray structures (bold), mutation studies (gray), or models without support from experimental data (gray italics) are depicted by dotted lines. (b,c) CXCR3 mutation effects on 65 and 66 binding mapped on helical box diagram (adapted from GPCRdb). The helical box of TM2 does not reflect the T2.56XP2.58 kink of chemokine receptors, depicting the residues of 2.60 and 2.63 toward the membrane surface while they are in fact pointing toward the TM binding site. (d) Predicted binding modes of 65 and 66, targeting both the minor and the major pockets of CXCR3. (e) Comparative structural interaction fingerprint (IFP) analysis of the predicted binding modes of 65 and 66 in CXCR3 presented in panel d. The structural receptor–ligand interaction patterns are described by IFP bit strings encoding different interaction types between the ligand and the different CXCR3 amino acid residues. (f) Differences between the pIC50a, pKdb, or pEC50c values of wild-type and mutant <−0.5 (cyan), −0.5 to 0.5 (blue), 0.5 to 1.0 (yellow), and >1.0 (red) logarithmic units are reported for 125 CXCR3 mutant–ligand combinations covering ligands 19, 6568, CXCL10, CXCL11, and 46 CXCR3 mutants (annotated mutation data set included in Supporting Information).
Figure 20
Figure 20
(a) Chemical structures of ligands investigated in CCR1, and CCR8 mutation studies. Interactions between the ligands and specific residues derived from mutation studies (gray), or models without support from experimental data (gray italics) are depicted by dotted lines. (b) Differences between the pIC50a, pEC50b, −log[fold change % inhibition CCL3-induced chemotactic response] (indicated as other)c values of wild-type and mutant <−0.5 (cyan), −0.5 to 0.5 (blue), 0.5 to 1.0 (yellow), and >1.0 (red) logarithmic units are reported for 22 CCR1 mutant–ligand combinations covering ligands 6970 and 16 mutants,, and 103 CCR8 mutant–ligand combinations covering ligands 7175 and 21 mutants (annotated mutation data set included in Supporting Information).
Figure 21
Figure 21
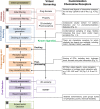
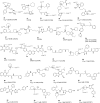
Customization of chemokine receptor structure-based virtual screening workflow. Different steps of the general structure-based virtual screening workflow (left, adapted from ref (212)) and their customization for chemokine receptors (right, described in section 6). The main steps in the structure-based virtual screening workflow are depicted in colored boxes and are complemented with chemokine receptor customized information in gray boxes on the right.
Figure 22
Figure 22
Representative ligands obtained in structure-based virtual screening (design) studies against chemokine receptors homology models and X-ray structures, including CXCR4 ligands 76,77,78,79,80,81,82,83,85,86,87, and CXCR4/CXCR3 dual ligands 84; CCR5 ligands 88,89,90,91,92, and CCR4 ligand 93,, and ACKR3/CXCR7 ligands 94,95, and 96. Interactions between the ligands and specific residues derived from X-ray structures (bold), mutation studies (gray), or models without support from experimental data (gray italics) are depicted by dotted lines. The affinity or potency values of ligands are reported.

Similar articles

Cited by

References

    1. Scholten D. J.; Canals M.; Maussang D.; Roumen L.; Smit M. J.; Wijtmans M.; de Graaf C.; Vischer H. F.; Leurs R. Pharmacological modulation of chemokine receptor function. Br. J. Pharmacol. 2012, 165, 1617–43. 10.1111/j.1476-5381.2011.01551.x. - DOI - PMC - PubMed
    1. Kufareva I.; Salanga C. L.; Handel T. M. Chemokine and chemokine receptor structure and interactions: implications for therapeutic strategies. Immunol. Cell Biol. 2015, 93, 372–83. 10.1038/icb.2015.15. - DOI - PMC - PubMed
    1. Bachelerie F.; Graham G. J.; Locati M.; Mantovani A.; Murphy P. M.; Nibbs R.; Rot A.; Sozzani S.; Thelen M. An atypical addition to the chemokine receptor nomenclature: IUPHAR Review 15. Br. J. Pharmacol. 2015, 172, 3945–9. 10.1111/bph.13182. - DOI - PMC - PubMed
    1. Allen S. J.; Crown S. E.; Handel T. M. Chemokine: receptor structure, interactions, and antagonism. Annu. Rev. Immunol. 2007, 25, 787–820. 10.1146/annurev.immunol.24.021605.090529. - DOI - PubMed
    1. Bongers G.; Maussang D.; Muniz L. R.; Noriega V. M.; Fraile-Ramos A.; Barker N.; Marchesi F.; Thirunarayanan N.; Vischer H. F.; Qin L.; Mayer L.; Harpaz N.; Leurs R.; Furtado G. C.; Clevers H.; Tortorella D.; Smit M. J.; Lira S. A. The cytomegalovirus-encoded chemokine receptor US28 promotes intestinal neoplasia in transgenic mice. J. Clin. Invest. 2010, 120, 3969–78. 10.1172/JCI42563. - DOI - PMC - PubMed

Publication types

MeSH terms

LinkOut - more resources