. 2017 Feb;10(1):30-40.
doi: 10.1007/s12195-016-0456-5. Epub 2016 Jul 6.

Cholesterol Enrichment Impairs Capacitative Calcium Entry, eNOS Phosphorylation & Shear Stress-Induced NO Production

Affiliations

Cholesterol Enrichment Impairs Capacitative Calcium Entry, eNOS Phosphorylation & Shear Stress-Induced NO Production

Allison M Andrews et al. Cell Mol Bioeng. 2017 Feb.

Abstract

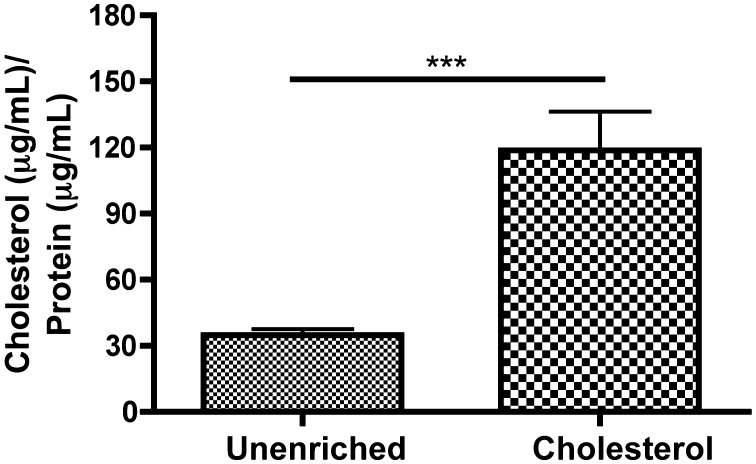
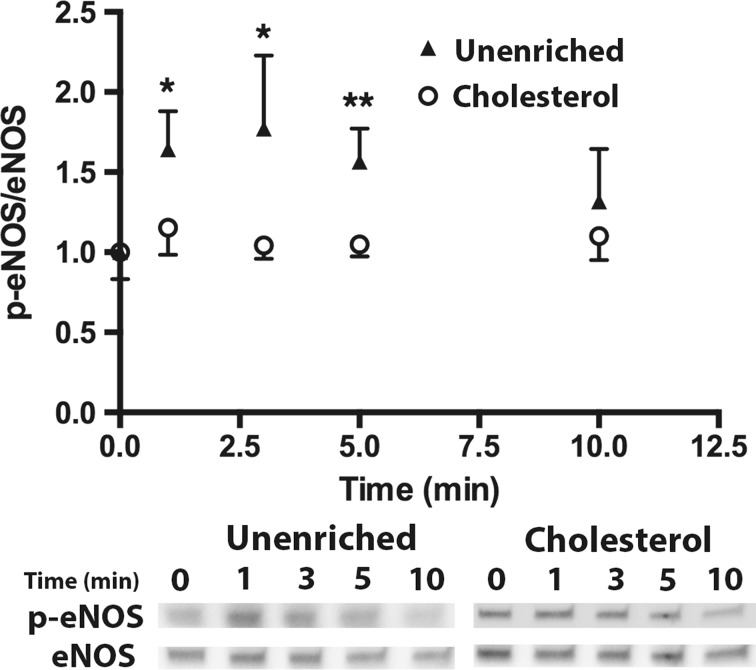
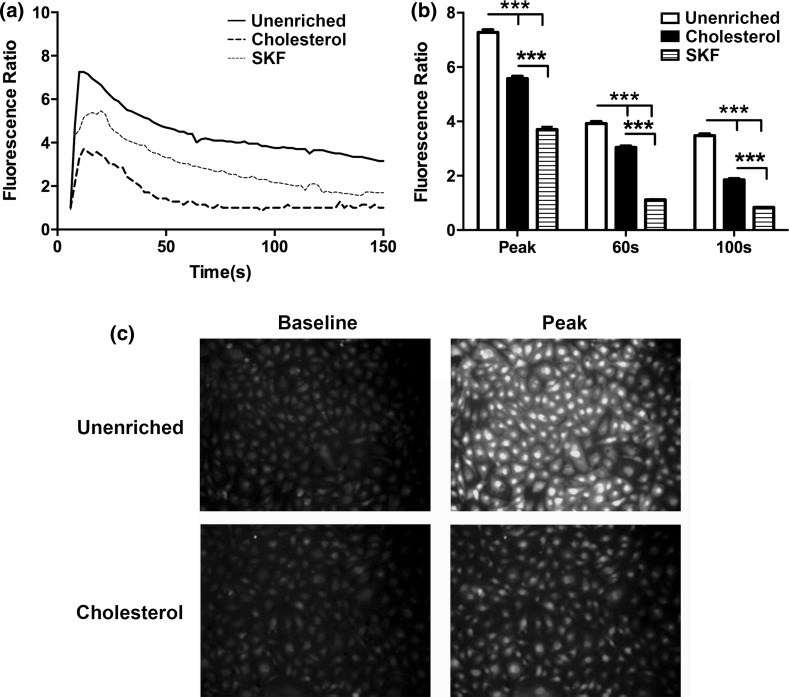
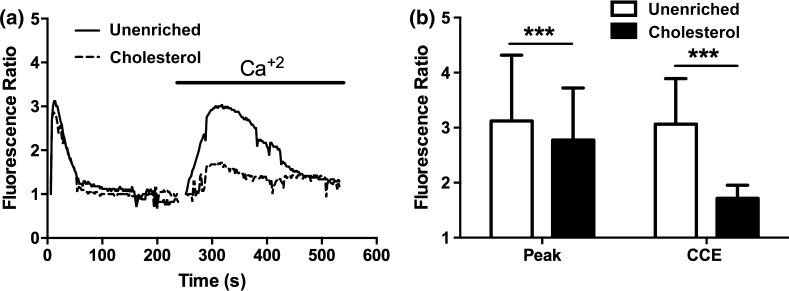
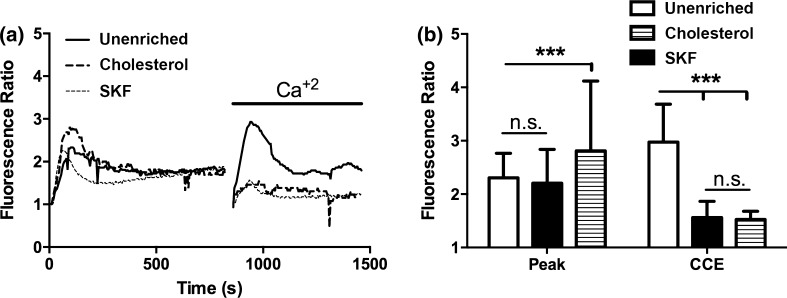
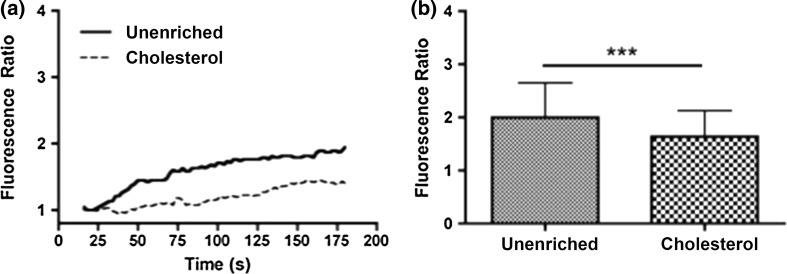
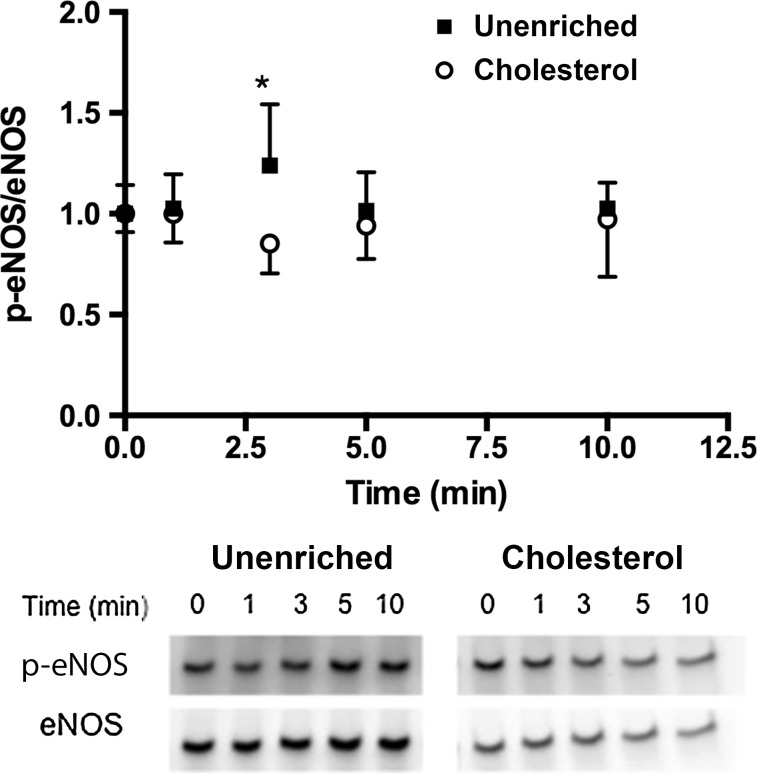
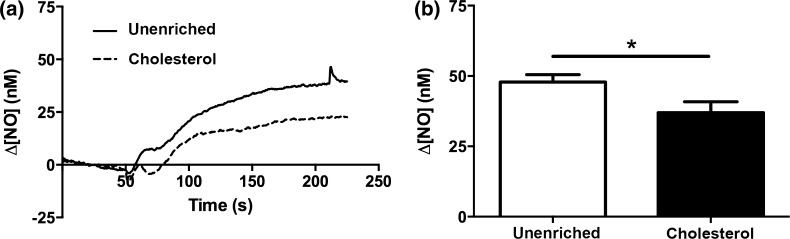
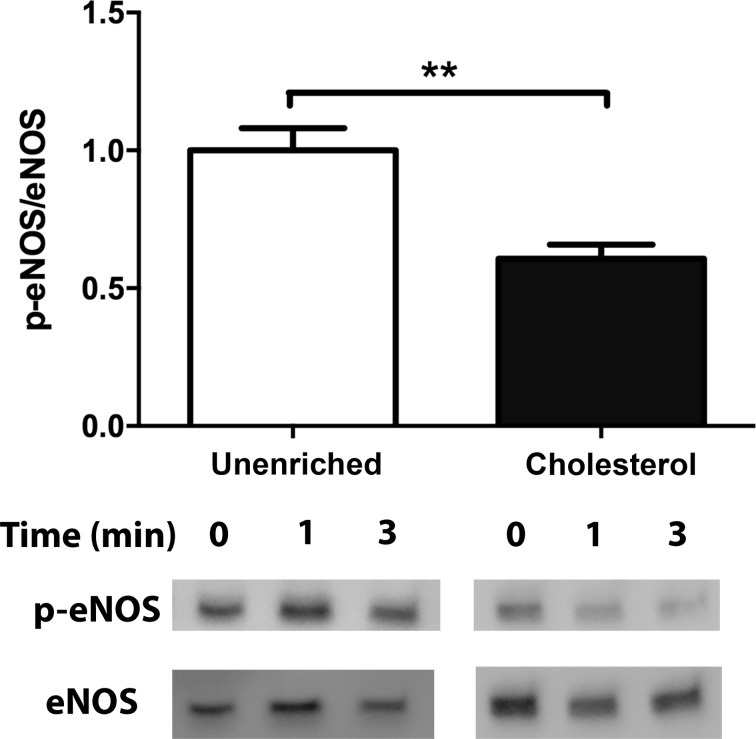
Endothelial dysfunction, characterized by decreased production or availability of nitric oxide (NO), is widely believed to be the hallmark of early-stage atherosclerosis. In addition, hypercholesterolemia is considered a major risk factor for development of atherosclerosis and is associated with impaired flow-induced dilation. However, the mechanism by which elevated cholesterol levels leads to decreased production of NO is unclear. NO is released in response to shear stress and agonist-evoked changes in intracellular calcium. Although calcium signaling is complex, we have previously shown that NO production by endothelial nitric oxide synthase (eNOS) is preferentially activated by calcium influx via store-operated channels. We hypothesized that cholesterol enrichment altered this signaling pathway (known as capacitive calcium entry; CCE) ultimately leading to decreased NO. Our results show that cholesterol enrichment abolished ATP-induced eNOS phosphorylation and attenuated the calcium response by the preferential inhibition of CCE. Furthermore, cholesterol enrichment also inhibited shear stress-induced NO production and eNOS phosporylation, consistent with our previous results showing a significant role for ATP autocrine stimulation and subsequent activation of CCE in the endothelial flow response.

Keywords: Atherosclerosis; Capacitative calcium entry; Cholesterol; Endothelial cells; Nitric oxide; Shear stress.


Conflict of interest statement

Ms. Muzorewa, Ms. Zaccheo, and Dr. Buerk have nothing to disclose. Dr. Andrews, Dr. Jaron and Dr. Barbee have a patent 8,828,711 issued.

Figures

Figure 1
Figure 1
Quantification of cholesterol enrichment using cholesterol-cyclodextrin complexes. Cells were incubated with either PBS with calcium/magnesium or 3.5 mM cholesterol for 30 min at 37 °C. Cells were lysed, and protein and cholesterol content were assayed. Cholesterol enriched cells showed a 3.5× increase in cholesterol as compared to unenriched cells. (Means and SEM were plotted, two-tailed t test ***p < 0.0001 n = 6 unenriched, n = 6 cholesterol).
Figure 2
Figure 2
Cholesterol inhibits ATP-induced eNOS phosphorylation. Cells were simulated with 100 µM ATP with Ca+2. Cells were treated with either PBS with Ca+2 or 3.5 mM cholesterol at 37 °C for 30 min prior to stimulation. Cells were harvested before stimulation (t = 0) and at time points 1, 3, 5, and 10 min after stimulation. All p-eNOS/eNOS ratios were normalized by t = 0. eNOS phosphorylation in cholesterol enriched cells (Cholesterol) is abolished in response to ATP. (Mean and SEM were plotted p < 0.05*, #; p < 0.01** two-tailed t test; Unenriched n = 4, Cholesterol n = 4).
Figure 3
Figure 3
Cholesterol enrichment attenuates the ATP agonist calcium response. Prior to the experiment, cells were incubated with PBS with Ca+2 for 30 min (solid line), 3.5 mM water-soluble cholesterol for 30 min (dashed line) or 50 μM of SOC inhibitor SKF-96365 for 10 min (dotted line). (a) Ca+2 response of each condition to 500 µL of 100 µM ATP dissolved in PBS with Ca+2. (b) Bar graph representing average responses for each condition at the peak response, 60 and 100 s. Cholesterol treated cells show a reduced transient and sustained calcium response, which was statically significant from unenriched and SKF treated cells. Average responses represent multiple coverslips (cs) and total cell count among coverslips (n) Unenriched: #cs = 8, n = 512; SKF: #cs = 5, n = 298; Cholesterol: #cs = 7, n = 441. Mean and SEM were plotted two-tailed t test p < 0.0001.
Figure 4
Figure 4
Cholesterol inhibits ATP stimulated capacitative calcium entry (CCE). Prior to the experiment, cells were incubated with PBS with Ca+2 (solid line) or 3.5 mM water soluble cholesterol (dashed line) for 30 min. (a) Representative traces of the Ca+2 response to 500 µL of 100 µM exogenous ATP in Ca+2 free PBS. After the initial response, the solution was replaced with 500 µL of PBS with Ca+2. (b) Bar graph representing the average responses for each condition at the initial response peak and the max after re-addition Ca+2, which represents capacitative calcium entry (CCE). Cholesterol enriched cells showed a slight reduction in the initial ER calcium response and a strong attenuation of the CCE calcium response as compared to unenriched cells. Average responses represent multiple coverslips (cs) and total cell count among coverslips (n) Unenriched: cs # = 5, n = 210; Cholesterol: cs# = 6, n = 321. Mean and SEM were plotted Two-tailed t test p < 0.0001.
Figure 5
Figure 5
Cholesterol attenuated the thapsigargin-activated capacitative calcium entry (CCE) similarly to SOC inhibition. Prior to experiment, cells were incubated with PBS with Ca+2 for 30 min (solid line), 3.5 mM water-soluble cholesterol for 30 min (dashed line) or 50 µM of SOC inhibitor SKF-96365 for 10 min (dotted line). (a) Shows representative traces of the calcium response to 1 μM Tg was added to cells in Ca+2 free PBS. After the initial response, the solution is replaced with 500 µL of PBS with Ca+2. (b) Bar graph representing average responses for each condition at initial response peak and after re-addition Ca+2, which represents capacitative calcium entry (CCE). Cholesterol enriched cells showed an increase in the ER calcium response and an attenuated CCE response, which was significantly different from unenriched cells. In addition, the CCE response in cholesterol-treated cells was not statistically different from cells treated with the SOC inhibitor SKF. (c) Representative images of the fluorescence signal at baseline and peak stimulation for unenriched and cholesterol treated coverslips. Average responses represent multiple coverslips (cs) and total cell count among coverslips (n) Unenriched: cs = 4, n = 225, Cholesterol: cs = 3, n = 169, SKF: cs = 3, n = 135. Mean and SEM were plotted Two-tailed t test ***p < 0.0001.
Figure 6
Figure 6
Cholesterol attenuates the LPC stimulated calcium response. Cells were stimulation with 300 nM of LPC. Prior to stimulation, cells were treated with either PBS with Ca+2 (solid line) or 3.5 mM cholesterol (dotted line) at 37 °C for 30 min. (a) Representative traces to LPC stimulation in unenriched and cholesterol treated cells. LPC stimulates a gradual increase in calcium that was attenuated by cholesterol enrichment. (b) Bar graph showing that cholesterol statistically attenuates the peak calcium response in 180 s to LPC. Average responses represent multiple coverslips (cs) and total cell count among coverslips (n) Unenriched: #cs = 9, n = 359, Cholesterol: #cs = 8, n = 320, Mean and SEM were plotted two-tailed t test ***p < 0.0001.
Figure 7
Figure 7
Cholesterol attenuates the LPC stimulated increase in eNOS phosphorylation. Prior to stimulation, cells were treated with either PBS with Ca+2 or 3.5 mM cholesterol at 37 °C for 30 min. Cells were stimulation with 300 nM of LPC. Cells were harvested before stimulation (t = 0) and at time points 1, 3, 5, and 10 min after stimulation. All p-eNOS/eNOS ratios were normalized by t = 0. LPC stimulates a small increase in eNOS phosphorylation that was attenuated by cholesterol enrichment. (*p < 0.05 Mean and SEM were plotted two tailed t test Unenriched n = 5, Cholesterol n = 6).
Figure 8
Figure 8
Cholesterol enrichment attenuates the steady state NO produced in response to flow. Cells were treated with either PBS with Ca+2 or 3.5 mM Cholesterol for 30 min at 37 °C prior to insertion into the chamber. Each membrane was exposed to a series of 4 step changes from 0.1 to 10 dyn/cm2, which represented the response of a single membrane. Response from multiple membranes were then averaged and compared. (a) Sample traces of the response for unenriched (solid line) and cholesterol treated (dotted line) cells. The steady-state concentration was offset to zero in order to show the individual NO response due to the step change occurring at 50 s. B. Bar graph showing the ∆[NO] response in unenriched and cholesterol enriched cells. Cholesterol enriched responses were reduced by 24% and were statistically significant (Mean and SEM were plotted, One-tailed t test. Unenriched n = 4, Cholesterol n = 3, *p < 0.05).
Figure 9
Figure 9
Cholesterol impairs the shear stress-induced increase in eNOS phosphorylation. Bar graph representation of the ratio of phosphorylated eNOS to total eNOS for unenriched and cholesterol enriched cells following exposure to 10 dyn/cm2 for 3 min. The response is normalized by the unenriched control (Mean and SEM were plotted, ***p < 0.001 one-tailed t test n = 5 unenriched, n = 6 cholesterol).

Similar articles

Cited by

References

    1. Ambudkar IS, Bandyopadhyay BC, Liu XB, Lockwich TP, Paria B, Ong HL. Functional organization of TRPC-Ca2+ channels and regulation of calcium microdomains. Cell Calcium. 2006;40:495–504. doi: 10.1016/j.ceca.2006.08.011. - DOI - PubMed
    1. Andrews AM, Jaron D, Buerk DG, Barbee KA. Shear stress-induced NO production is dependent on ATP autocrine signaling and capacitative calcium entry. Cell Mol. Bioeng. 2014;7:510–520. doi: 10.1007/s12195-014-0351-x. - DOI - PMC - PubMed
    1. Andrews AM, Jaron D, Buerk DG, Kirby PL, Barbee KA. Direct, real-time measurement of shear stress-induced nitric oxide produced from endothelial cells in vitro. Nitric Oxide. 2010;23:335–342. doi: 10.1016/j.niox.2010.08.003. - DOI - PMC - PubMed
    1. Bastiaanse EML, Hold KM, VanderLaarse A. The effect of membrane cholesterol content on ion transport processes in plasma membranes. Cardiovasc. Res. 1997;33:272–283. doi: 10.1016/S0008-6363(96)00193-9. - DOI - PubMed
    1. Bialecki RA, Tulenko TN. Excess membrane cholesterol alters calcium channels in arterial smooth muscle. Am. J. Physiol. 1989;257:C306–C314. - PubMed

LinkOut - more resources