Transcriptional, Functional, and Mechanistic Comparisons of Stem Cell-Derived Hepatocytes, HepaRG Cells, and Three-Dimensional Human Hepatocyte Spheroids as Predictive In Vitro Systems for Drug-Induced Liver Injury
- PMID: 28137721
- PMCID: PMC5363699
- DOI: 10.1124/dmd.116.074369
Transcriptional, Functional, and Mechanistic Comparisons of Stem Cell-Derived Hepatocytes, HepaRG Cells, and Three-Dimensional Human Hepatocyte Spheroids as Predictive In Vitro Systems for Drug-Induced Liver Injury
Abstract
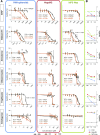
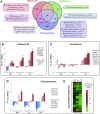
Reliable and versatile hepatic in vitro systems for the prediction of drug pharmacokinetics and toxicity are essential constituents of preclinical safety assessment pipelines for new medicines. Here, we compared three emerging cell systems-hepatocytes derived from induced pluripotent stem cells, HepaRG cells, and three-dimensional primary human hepatocyte (PHH) spheroids-at transcriptional and functional levels in a multicenter study to evaluate their potential as predictive models for drug-induced hepatotoxicity. Transcriptomic analyses revealed widespread gene expression differences between the three cell models, with 8148 of 17,462 analyzed genes (47%) being differentially expressed. Expression levels of genes involved in the metabolism of endogenous as well as xenobiotic compounds were significantly elevated in PHH spheroids, whereas genes involved in cell division and endocytosis were significantly upregulated in HepaRG cells and hepatocytes derived from induced pluripotent stem cells, respectively. Consequently, PHH spheroids were more sensitive to a panel of drugs with distinctly different toxicity mechanisms, an effect that was amplified by long-term exposure using repeated treatments. Importantly, toxicogenomic analyses revealed that transcriptomic changes in PHH spheroids were in compliance with cholestatic, carcinogenic, or steatogenic in vivo toxicity mechanisms at clinically relevant drug concentrations. Combined, the data reveal important phenotypic differences between the three cell systems and suggest that PHH spheroids can be used for functional investigations of drug-induced liver injury in vivo in humans.
Copyright © 2017 by The Author(s).
Figures


Similar articles
-
Characterization of primary human hepatocyte spheroids as a model system for drug-induced liver injury, liver function and disease.Sci Rep. 2016 May 4;6:25187. doi: 10.1038/srep25187. Sci Rep. 2016. PMID: 27143246 Free PMC article.
-
HepaRG microencapsulated spheroids in DMSO-free culture: novel culturing approaches for enhanced xenobiotic and biosynthetic metabolism.Arch Toxicol. 2015 Aug;89(8):1347-58. doi: 10.1007/s00204-014-1320-9. Epub 2014 Aug 9. Arch Toxicol. 2015. PMID: 25107451
-
Prediction of Drug-Induced Liver Injury in Micropatterned Co-cultures Containing iPSC-Derived Human Hepatocytes.Toxicol Sci. 2015 Jun;145(2):252-62. doi: 10.1093/toxsci/kfv048. Epub 2015 Feb 24. Toxicol Sci. 2015. PMID: 25716675
-
Human hepatocytes derived from pluripotent stem cells: a promising cell model for drug hepatotoxicity screening.Arch Toxicol. 2016 Sep;90(9):2049-2061. doi: 10.1007/s00204-016-1756-1. Epub 2016 Jun 20. Arch Toxicol. 2016. PMID: 27325232 Review.
-
Fish hepatocyte spheroids - A powerful (though underexplored) alternative in vitro model to study hepatotoxicity.Comp Biochem Physiol C Toxicol Pharmacol. 2022 Dec;262:109470. doi: 10.1016/j.cbpc.2022.109470. Epub 2022 Sep 16. Comp Biochem Physiol C Toxicol Pharmacol. 2022. PMID: 36122680 Review.
Cited by
-
Immune-Mediated Drug-Induced Liver Injury: Immunogenetics and Experimental Models.Int J Mol Sci. 2021 Apr 27;22(9):4557. doi: 10.3390/ijms22094557. Int J Mol Sci. 2021. PMID: 33925355 Free PMC article. Review.
-
Oxidative-stress and long-term hepatotoxicity: comparative study in Upcyte human hepatocytes and hepaRG cells.Arch Toxicol. 2022 Apr;96(4):1021-1037. doi: 10.1007/s00204-022-03236-y. Epub 2022 Feb 14. Arch Toxicol. 2022. PMID: 35156134
-
A Comparative Assessment of Human and Chimpanzee iPSC-derived Cardiomyocytes with Primary Heart Tissues.Sci Rep. 2018 Oct 17;8(1):15312. doi: 10.1038/s41598-018-33478-9. Sci Rep. 2018. PMID: 30333510 Free PMC article.
-
Comparison of Hepatic 2D Sandwich Cultures and 3D Spheroids for Long-term Toxicity Applications: A Multicenter Study.Toxicol Sci. 2018 Apr 1;162(2):655-666. doi: 10.1093/toxsci/kfx289. Toxicol Sci. 2018. PMID: 29329425 Free PMC article.
-
Human resident liver myeloid cells protect against metabolic stress in obesity.Nat Metab. 2023 Jul;5(7):1188-1203. doi: 10.1038/s42255-023-00834-7. Epub 2023 Jul 6. Nat Metab. 2023. PMID: 37414931 Free PMC article.
References
-
- Anderson N, Borlak J. (2006) Drug-induced phospholipidosis. FEBS Lett 580:5533–5540. - PubMed
-
- Anthérieu S, Rogue A, Fromenty B, Guillouzo A, Robin MA. (2011) Induction of vesicular steatosis by amiodarone and tetracycline is associated with up-regulation of lipogenic genes in HepaRG cells. Hepatology 53:1895–1905. - PubMed
-
- Ayd FJ., Jr (1956) The dermatologic and systemic manifestations of chlorpromazine hypersensitivity; their clinical significance and management. J Nerv Ment Dis 124:84–87. - PubMed
-
- Bates DW, Spell N, Cullen DJ, Burdick E, Laird N, Petersen LA, Small SD, Sweitzer BJ, Leape LL, Adverse Drug Events Prevention Study Group (1997) The costs of adverse drug events in hospitalized patients. JAMA 277:307–311. - PubMed
Publication types
MeSH terms
Substances
LinkOut - more resources
Full Text Sources
Other Literature Sources
Molecular Biology Databases
