Xist-dependent imprinted X inactivation and the early developmental consequences of its failure
- PMID: 28134930
- PMCID: PMC5337400
- DOI: 10.1038/nsmb.3365
Xist-dependent imprinted X inactivation and the early developmental consequences of its failure
Abstract
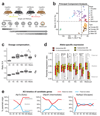
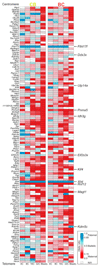
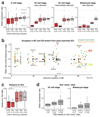
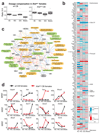
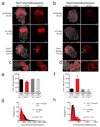
The long noncoding RNA Xist is expressed from only the paternal X chromosome in mouse preimplantation female embryos and mediates transcriptional silencing of that chromosome. In females, absence of Xist leads to postimplantation lethality. Here, through single-cell RNA sequencing of early preimplantation mouse embryos, we found that the initiation of imprinted X-chromosome inactivation absolutely requires Xist. Lack of paternal Xist leads to genome-wide transcriptional misregulation in the early blastocyst and to failure to activate the extraembryonic pathway that is essential for postimplantation development. We also demonstrate that the expression dynamics of X-linked genes depends on the strain and parent of origin as well as on the location along the X chromosome, particularly at the first 'entry' sites of Xist. This study demonstrates that dosage-compensation failure has an effect as early as the blastocyst stage and reveals genetic and epigenetic contributions to orchestrating transcriptional silencing of the X chromosome during early embryogenesis.
Conflict of interest statement
The authors declare no competing financial interests.
Figures
Similar articles
-
A new Xist allele driven by a constitutively active promoter is dominated by Xist locus environment and exhibits the parent-of-origin effects.Development. 2015 Dec 15;142(24):4299-308. doi: 10.1242/dev.128819. Epub 2015 Oct 28. Development. 2015. PMID: 26511926
-
Effects of X chromosome number and parental origin on X-linked gene expression in preimplantation mouse embryos.Biol Reprod. 2000 Jul;63(1):64-73. doi: 10.1095/biolreprod63.1.64. Biol Reprod. 2000. PMID: 10859243
-
Eutherian mammals use diverse strategies to initiate X-chromosome inactivation during development.Nature. 2011 Apr 21;472(7343):370-4. doi: 10.1038/nature09872. Epub 2011 Apr 6. Nature. 2011. PMID: 21471966
-
What makes the maternal X chromosome resistant to undergoing imprinted X inactivation?Philos Trans R Soc Lond B Biol Sci. 2017 Nov 5;372(1733):20160365. doi: 10.1098/rstb.2016.0365. Philos Trans R Soc Lond B Biol Sci. 2017. PMID: 28947661 Free PMC article. Review.
-
The Role of Xist in X-Chromosome Dosage Compensation.Trends Cell Biol. 2018 Dec;28(12):999-1013. doi: 10.1016/j.tcb.2018.05.005. Epub 2018 Jun 14. Trends Cell Biol. 2018. PMID: 29910081 Free PMC article. Review.
Cited by
-
Cross-species meta-analysis of transcriptome changes during the morula-to-blastocyst transition: metabolic and physiological changes take center stage.Am J Physiol Cell Physiol. 2021 Dec 1;321(6):C913-C931. doi: 10.1152/ajpcell.00318.2021. Epub 2021 Oct 20. Am J Physiol Cell Physiol. 2021. PMID: 34669511 Free PMC article.
-
Deep learning-based models for preimplantation mouse and human embryos based on single-cell RNA sequencing.Nat Methods. 2025 Jan;22(1):207-216. doi: 10.1038/s41592-024-02511-3. Epub 2024 Nov 14. Nat Methods. 2025. PMID: 39543284 Free PMC article.
-
XIST directly regulates X-linked and autosomal genes in naive human pluripotent cells.Cell. 2024 Jan 4;187(1):110-129.e31. doi: 10.1016/j.cell.2023.11.033. Cell. 2024. PMID: 38181737 Free PMC article.
-
In Vivo Clonal Analysis Reveals Random Monoallelic Expression in Lymphocytes That Traces Back to Hematopoietic Stem Cells.Front Cell Dev Biol. 2022 Aug 8;10:827774. doi: 10.3389/fcell.2022.827774. eCollection 2022. Front Cell Dev Biol. 2022. PMID: 36003148 Free PMC article.
-
Recent Advances in Understanding the Reversal of Gene Silencing During X Chromosome Reactivation.Front Cell Dev Biol. 2019 Sep 3;7:169. doi: 10.3389/fcell.2019.00169. eCollection 2019. Front Cell Dev Biol. 2019. PMID: 31552244 Free PMC article. Review.
References
-
- Lyon MF. Gene action in the X-chromosome of the mouse (Mus musculus L.) Nature. 1961;190:372–3. - PubMed
-
- Okamoto I, et al. Evidence for de novo imprinted X-chromosome inactivation independent of meiotic inactivation in mice. Nature. 2005;438:369–373. - PubMed
-
- Okamoto I, Otte AP, Allis CD, Reinberg D, Heard E. Epigenetic dynamics of imprinted X inactivation during early mouse development. Science. 2004;303:644–9. - PubMed
-
- Mak W, et al. Reactivation of the paternal X chromosome in early mouse embryos. Science. 2004;303:666–9. - PubMed
-
- Galupa R, Heard E. X-chromosome inactivation: New insights into cis and trans regulation. Curr Opin Genet Dev. 2015;31:57–66. - PubMed
Publication types
MeSH terms
Substances
Grants and funding
LinkOut - more resources
Full Text Sources
Other Literature Sources
Molecular Biology Databases

