

Protein abundance of AKT and ERK pathway components governs cell type-specific regulation of proliferation
- PMID: 28123004
- PMCID: PMC5293153
- DOI: 10.15252/msb.20167258
Protein abundance of AKT and ERK pathway components governs cell type-specific regulation of proliferation
Abstract
Signaling through the AKT and ERK pathways controls cell proliferation. However, the integrated regulation of this multistep process, involving signal processing, cell growth and cell cycle progression, is poorly understood. Here, we study different hematopoietic cell types, in which AKT and ERK signaling is triggered by erythropoietin (Epo). Although these cell types share the molecular network topology for pro-proliferative Epo signaling, they exhibit distinct proliferative responses. Iterating quantitative experiments and mathematical modeling, we identify two molecular sources for cell type-specific proliferation. First, cell type-specific protein abundance patterns cause differential signal flow along the AKT and ERK pathways. Second, downstream regulators of both pathways have differential effects on proliferation, suggesting that protein synthesis is rate-limiting for faster cycling cells while slower cell cycles are controlled at the G1-S progression. The integrated mathematical model of Epo-driven proliferation explains cell type-specific effects of targeted AKT and ERK inhibitors and faithfully predicts, based on the protein abundance, anti-proliferative effects of inhibitors in primary human erythroid progenitor cells. Our findings suggest that the effectiveness of targeted cancer therapy might become predictable from protein abundance.
Keywords: MAPK; 32D‐EpoR; BaF3‐EpoR; CFU‐E; PI3K.
© 2017 The Authors. Published under the terms of the CC BY 4.0 license.
Figures
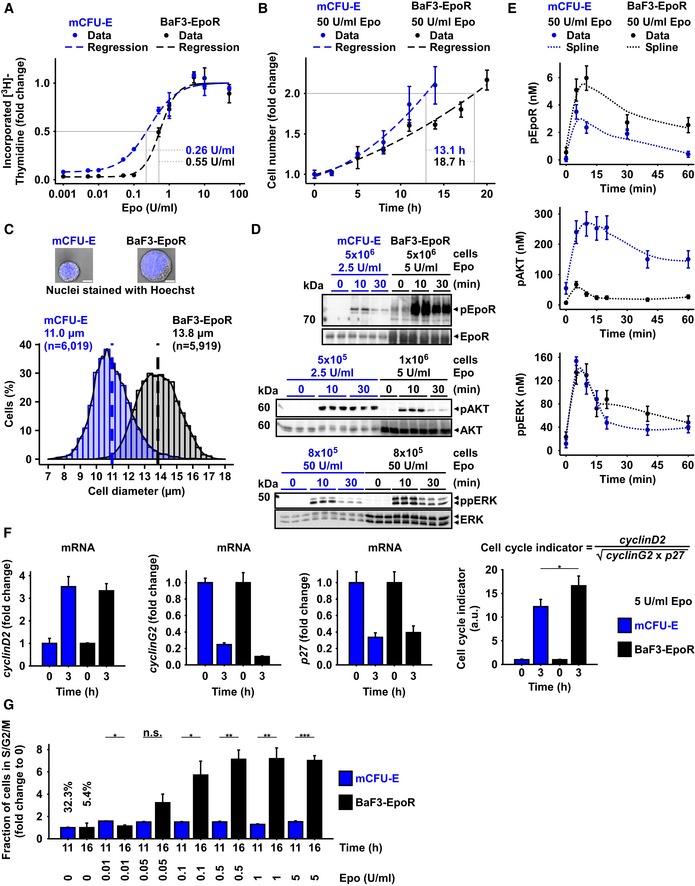
DNA content of mCFU‐E and BaF3‐EpoR cells in response to different Epo concentrations. [3H]‐thymidine incorporation was measured after 14 h (mCFU‐E) or 38 h (BaF3‐EpoR). Data represented as mean ± standard deviation, N = 3. Lines represent sigmoidal regression. EC50 values are given.
Cell doubling with time in response to 50 U/ml Epo. Cell numbers were determined by manual counting using trypan blue exclusion assay. Data represented as mean ± standard deviation, N = 3. Lines represent exponential regression. Doubling time is indicated.
Size determinations of mCFU‐E and BaF3‐EpoR cells. Exemplary fluorescence microscopy pictures upon Hoechst staining for nucleus visualization with 60× objective. The bar represents 10 μm distance (upper panel). Cell diameter was measured by imaging flow cytometry. Cytoplasm was stained with calcein, and nuclei were stained with DRAQ5. Probability density function of size distribution with indicated mean diameter of mCFU‐E and BaF3‐EpoR cells. All cells were growth factor‐deprived and unstimulated.
Epo‐induced phosphorylation of EpoR, AKT, and ERK of mCFU‐E and BaF3‐EpoR cells. Above each panel, the number of growth factor‐deprived cells examined per time point is indicated as well as the concentration of Epo applied for stimulation. To the left, the position of the molecular weight marker is indicated in kDa and arrowheads indicate the position of the protein of interest. For the detection of the EpoR, 5 × 10⁶ mCFU‐E cells were stimulated with 2.5 U/ml Epo and 5 × 10⁶ BaF3‐EpoR cells were stimulated with 5 U/ml Epo. Cells were lysed, subjected to immunoprecipitation with anti‐EpoR, and were analyzed by immunoblotting using either anti‐pTyr (pEpoR) or anti‐EpoR (EpoR) antibodies. For the detection of AKT, mCFU‐E cells were stimulated with 2.5 U/ml Epo and BaF3‐EpoR cells were stimulated with 5 U/ml Epo. Per time point, cellular lysates equivalent to 5 × 10⁵ mCFU‐E cells and 1 × 10⁶ BaF3‐EpoR cells were analyzed by immunoblotting using anti‐pAKT and anti‐AKT antibodies. For the detection of ERK, cells were stimulated with 50 U/ml Epo. Per time point, cellular lysates equivalent to 8 × 10⁵ cells were analyzed by immunoblotting. Immunoblot detection was performed with chemiluminescence utilizing a CCD camera device (ImageQuant).
Absolute concentrations of pEpoR, pAKT, and ppERK in mCFU‐E and BaF3‐EpoR cells with time in response to 50 U/ml Epo. Experimental data of a representative experiment are depicted with filled circles, and dashed lines represent splines. Error bars indicate standard deviation estimated by an error model. N = 1.
Expression of cell cycle indicator genes of mCFU‐E and BaF3‐EpoR cells in response to 5 U/ml Epo. Genes were selected based on microarray analysis. Experimental data are shown as fold change to unstimulated cells with mean ± standard deviation, N = 3. Welch modified two‐sample t‐test, *P < 0.05.
Fold change of fractions of cells in S/G2/M phase of the cell cycle with respect to 0 U/ml Epo. Growth factor‐deprived cells were stimulated with indicated Epo doses for given time. Fractions in sub‐G1, G1, S, G2/M were determined by propidium iodide (PI) staining for DNA content. Data represented as mean ± standard deviation, N = 3. Welch modified two‐sample t‐test, n.s. = not significant, *P < 0.05, **P < 0.01, ***P < 0.005. The percentage of cells in S/G2/M phase in unstimulated cells is additionally indicated.
- A
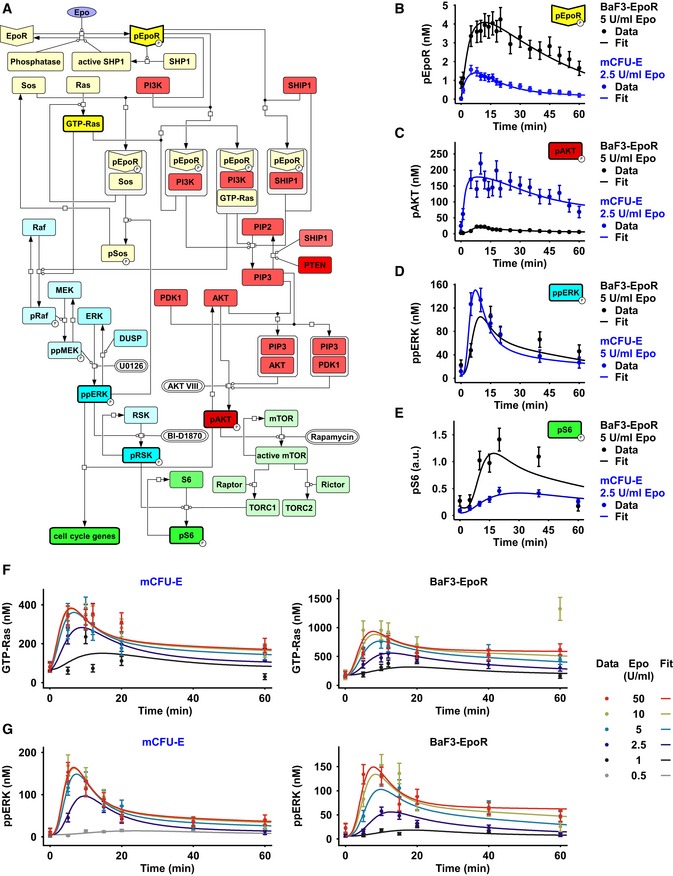
The model is represented as a process diagram and reactions are modulated by enzyme catalysis (circle‐headed lines) or inhibition (bar‐headed lines). Prefix “p” represents phosphorylated species. Bold framed species were experimentally measured. White capsules represent inhibitors. Binding of the ligand Epo to its cognate receptor results in the phosphorylation of EpoR. Receptor and associated complexes are depicted in yellow, the AKT pathway is red, the ERK pathway is blue, and cell cycle genes and the S6 network are shown in green.
- B–G
Model calibration with time‐resolved quantitative immunoblot data of mCFU‐E cells in blue and BaF3‐EpoR cells in black. Growth factor‐deprived mCFU‐E cells (5 × 10⁶ cells per condition) and BaF3‐EpoR cells (1 × 10⁷ cells per condition) were stimulated with different Epo doses, and absolute concentrations were determined for pEpoR (B), pAKT (C), ppERK (D). The scale for pS6 (E) was estimated in arbitrary units. GTP‐Ras (F) and ppERK were determined upon stimulation with indicated, color‐coded Epo doses. pEpoR was analyzed by immunoprecipitation followed by immunoblotting, GTP‐Ras was analyzed after pulldown using a fusion protein harboring GST fused to the Ras binding domain of Raf‐1 followed by detection by quantitative immunoblotting. For pAkt and ppERK, cellular lysates were subjected to quantitative immunoblotting. Calibrator proteins were used for EpoR, AKT, GTP‐Ras, and ERK to facilitate the conversion to nM concentrations. Experimental data are represented by filled circles. Error bars represent standard deviation estimated by an error model. Solid lines represent model trajectories. N = 1.
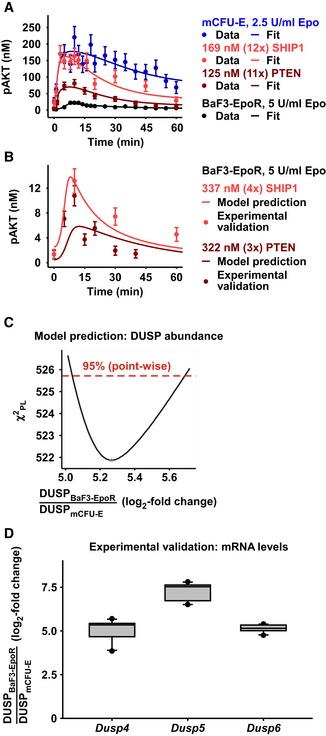
Model calibration with mCFU‐E wild‐type cells, and mCFU‐E cells overexpressing SHIP1 or PTEN, and BaF3‐EpoR wild‐type cells. Experimental data are represented by filled circles. Error bars represent standard deviation estimated by an error model. Solid lines represent model trajectories. N = 1.
Model prediction of pAKT dynamics in BaF3‐EpoR cells overexpressing PTEN or SHIP1. Model predictions are represented by solid lines. Experimental validation data obtained by quantitative immunoblotting are represented by filled circles. Error bars represent standard deviation estimated by an error model. A representative experiment is shown. N = 1.
Model prediction for the basal expression level of the dual‐specific phosphatase (DUSP). DUSP abundance ratio between BaF3‐EpoR and mCFU‐E cells was identified by the mathematical model. The solid line indicates the profile likelihood. The dashed red line indicates the threshold to assess point‐wise 95% confidence interval. The asterisk indicates the optimal parameter value.
Experimental validation of basal DUSP expression in mCFU‐E and BaF3‐EpoR. Quantitative RT–PCR was performed with all samples on the same plate, allowing a direct comparison of mRNA levels between mCFU‐E and BaF3‐EpoR cells. Data are normalized to the Rpl32 gene. Ratios of expression in BaF3‐EpoR cells compared with mCFU‐E cells are shown as box plots. Boxes indicate the interquartile range and whiskers extend to 1.5 × interquartile range. N = 10. For details, see Appendix K.
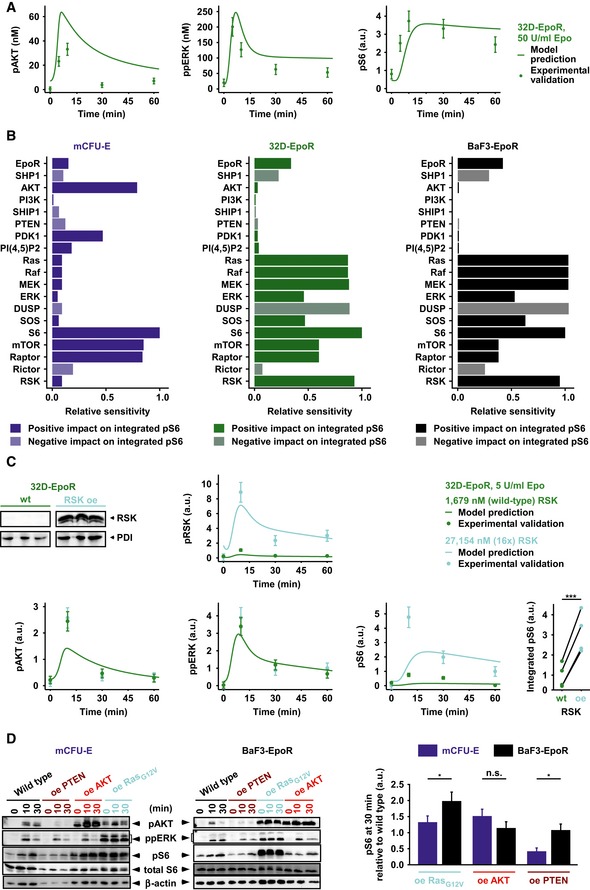
Model prediction and experimental validation for pAKT, ppERK, and pS6 dynamics of 32D‐EpoR cells in response to 50 U/ml Epo. Simulations are based on measured, cell type‐specific protein abundance of 32D‐EpoR cells and global kinetic rates estimated from mCFU‐E and BaF3‐EpoR cells. Model predictions are represented by solid lines. Experimental validation data obtained by quantitative immunoblotting are represented by filled circles. Error bars represent standard deviation estimated by an error model, N = 1.
Sensitivity analysis for integrated pS6 in mCFU‐E, 32D‐EpoR, and BaF3‐EpoR cells. Measured, cell type‐specific protein abundance and estimated global kinetic rates were taken into account. Proteins were grouped according to the network modules. Integrated pS6 exhibited high sensitivity toward RSK in 32D‐EpoR and BaF3‐EpoR cells but not in mCFU‐E cells.
Model prediction and experimental validation for RSK, AKT, ERK, and S6 activation upon RSK overexpression (oe) and 5 U/ml Epo stimulation in 32D‐EpoR cells. Simulations are based on measured, cell type‐specific protein abundance of 32D‐EpoR cells and global kinetic rates estimated from mCFU‐E and BaF3‐EpoR cells. Model predictions are represented by solid lines. Experimental validation data obtained by quantitative immunoblotting are represented by filled circles. Error bars represent standard deviation estimated by an error model. Integrated pS6 was significantly higher upon RSK overexpression as compared to 32D‐EpoR wild‐type (wt) cells, N = 4 (lower right panel). Two‐sample t‐test, ***P < 0.005.
Impact of AKT, Ras, or PTEN overexpression on Epo‐induced pS6 dynamics in mCFU‐E and BaF3‐EpoR cells. Quantitative immunoblotting upon overexpression of PTEN, AKT, a constitutively active Ras protein, or the empty vector control in mCFU‐E cells or BaF3‐EpoR cells. Growth factor‐deprived mCFU‐E cells (5 × 10⁶ cells per condition) and BaF3‐EpoR cells (1 × 10⁷ cells per condition) were stimulated with 5 U/ml Epo for indicated time points. Cellular lysates were analyzed by immunoblotting employing sequential reprobing anti‐pAKT, anti‐ppERK, anti‐pS6, anti‐S6, and to ensure equal loading with anti‐β‐actin antibodies. Detection was performed with chemiluminescence using a CCD camera device (ImageQuant). Quantification of pS6 on the right is depicted as fold change to wild‐type samples at 30 min after Epo stimulation. Error bars represent standard deviation. oe: overexpression. N = 3. Welch modified two‐sample t‐test, n.s. = not significant, *P < 0.05.
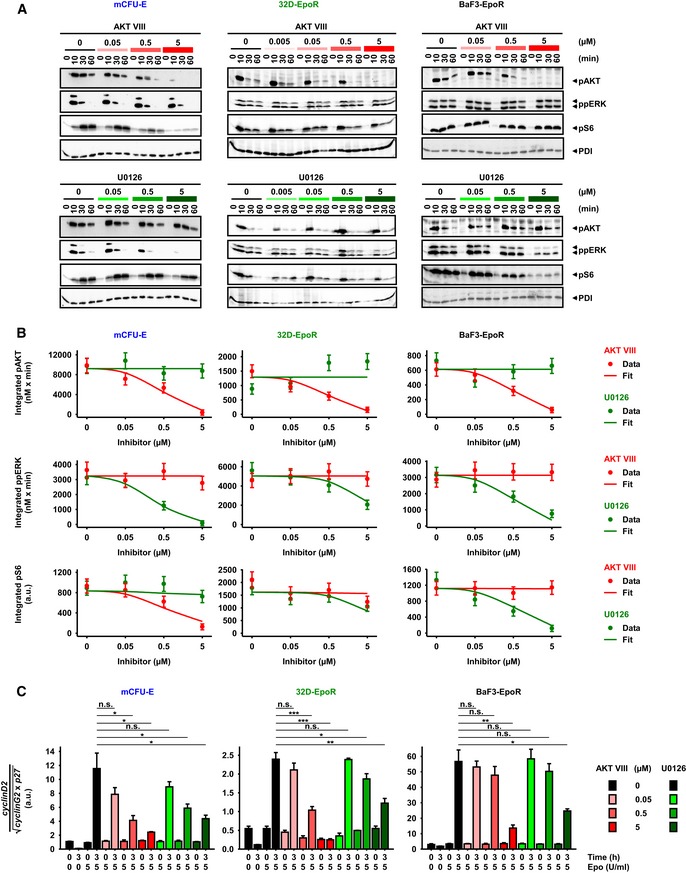
Epo‐induced signaling upon AKT or MEK inhibitor treatment. Growth factor‐deprived cells were pretreated for half an hour with AKT VIII or U0126, respectively, and subsequently stimulated with 5 U/ml Epo. PDI served as loading control.
Model calibration with integrated pAKT, ppERK, and pS6 data upon inhibitor treatment and 5 U/ml Epo stimulation of mCFU‐E, 32D‐EpoR, and BaF3‐EpoR cells. Area under curve from time‐resolved, quantitative immunoblotting data was calculated and is represented by filled circles. N = 3. Error bars represent standard deviation estimated by an error model. Solid lines represent model trajectories.
Analysis of cell cycle indicator genes upon AKT VIII and U0126 treatment. Growth factor‐deprived cells were pretreated for half an hour with indicated doses of a single inhibitor, followed by stimulation with 5 U/ml Epo for 0 and 3 h. The expression of cyclinD2, cyclinG2, and p27 was measured by quantitative RT–PCR and normalized to the Rpl32 gene. Genes were selected based on microarray analysis. Experimental data are shown as fold change to unstimulated cells with mean ± standard deviation, N = 3. Welch modified two‐sample t‐test, n.s. not significant, *P < 0.05, **P < 0.01, ***P < 0.005.
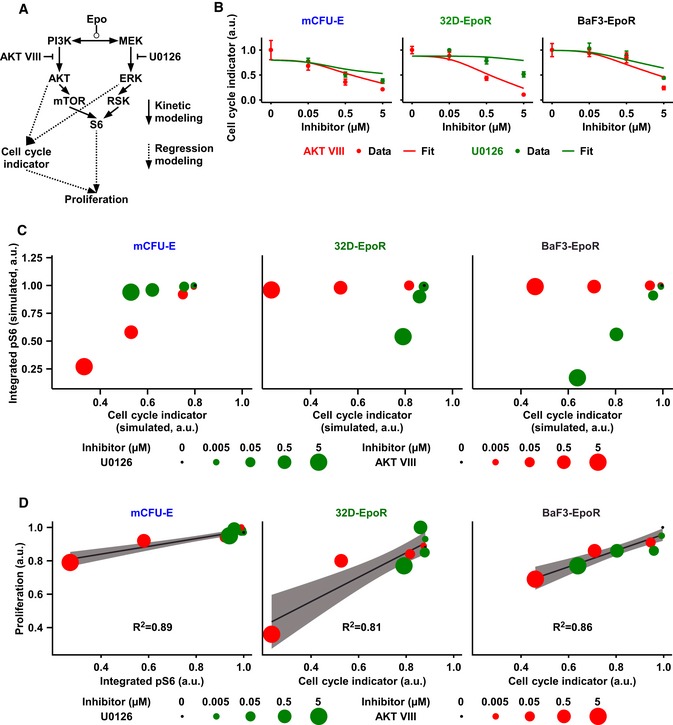
Scheme of the mathematical model. Integrated pAKT and ppERK obtained from our kinetic model were linked by linear regression analysis to measured cell cycle indicator. Similarly, cell cycle indicator and integrated pS6 were linked to measured proliferation by linear regression analysis and model selection.
Linear regression fit for the respective cell cycle indicator of experimental data. Data points represent mean ± standard deviation, N = 3. Solid lines represent the linear regression fit.
Simulated integrated pS6 response versus simulated cell cycle indicator of mCFU‐E, BaF3‐EpoR, and 32D‐EpoR cells upon 5 U/ml Epo stimulation and single inhibitor treatment at indicated doses.
Linear regression modeling and model selection revealed that while proliferation of mCFU‐E cells is best described by integrated pS6 only, for 32D‐EpoR and BaF3‐EpoR cells proliferation correlates mainly with cell cycle indicator. Proliferation was measured, and integrated pS6 and cell cycle indicator were simulated with our mathematical model. The linear regression model selection is based on Akaike's information criterion. The respective correlation is given. For details, see Appendix N and O.
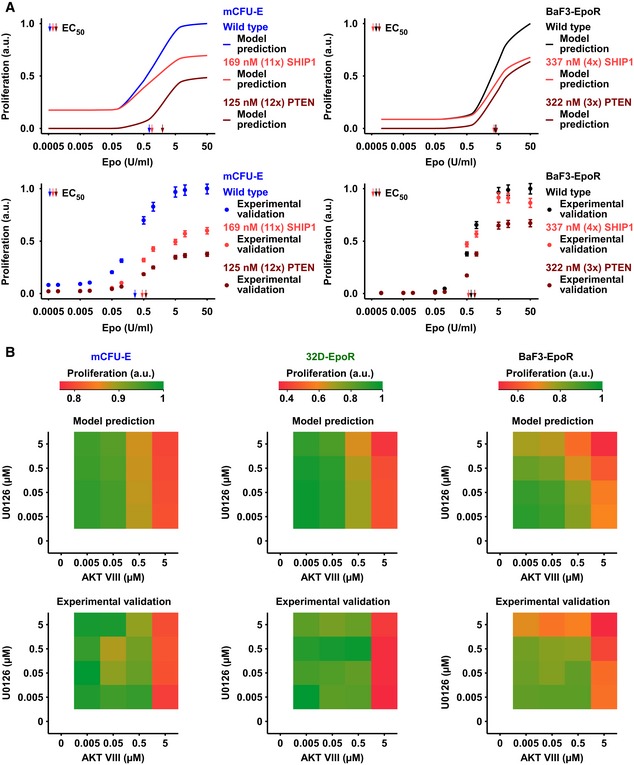
Upper panel: Model prediction of Epo‐dependent proliferation in mCFU‐E and BaF3‐EpoR cells overexpressing SHIP1 or PTEN. Solid lines represent model trajectories. Lower panel: Experimental validation of PTEN and SHIP1 overexpression effects on Epo‐dependent proliferation. Proliferation was assessed using [3H]‐thymidine incorporation 14 h (mCFU‐E) or 38 h (BaF3‐EpoR) after retroviral transduction with PTEN or SHIP1 construct for overexpression. Data are represented as mean ± standard deviation, N = 3. EC50 values are given.
Upper panel: Model prediction of proliferation upon combined inhibitor treatment and 5 U/ml Epo stimulation. Maximum proliferation was scaled to 1. Lower panel: Experimental validation of proliferation upon combined inhibitor treatment and 5 U/ml Epo stimulation. Proliferation was measured as cell numbers after 14 h (mCFU‐E) or 38 h (BaF3‐EpoR, 32D‐EpoR) with Coulter Counter. Maximum was scaled to 1.
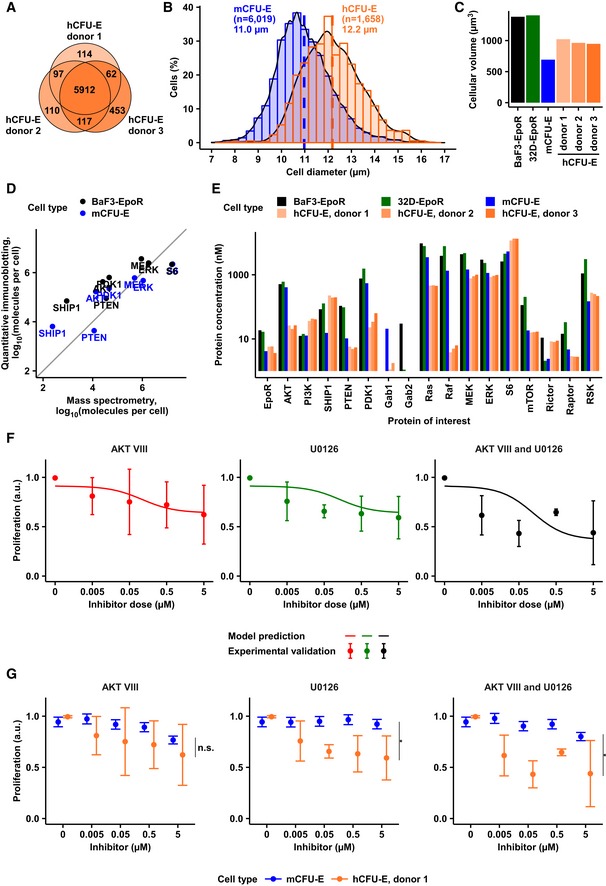
Venn diagram representing overlap of hCFU‐E proteome from three independent healthy donors. In total, 6,925 proteins were quantified.
Size determinations of hCFU‐E compared to mCFU‐E cells. Cell diameter was measured by imaging flow cytometry. Cytoplasm was stained with calcein, and nuclei were stained with DRAQ5. Probability density function of size distribution with indicated mean diameter of hCFU‐E and mCFU‐E cells. All cells were growth factor‐deprived and unstimulated.
Cytoplasmic volumes of BaF3‐EpoR, 32D‐EpoR, mCFU‐E, and the hCFU‐E cells. All volumes were determined using imaging flow cytometry as described in (B).
Correlation between protein molecules per cell for key signaling components determined by quantitative immunoblotting or quantitative mass spectrometry and the “proteomic ruler” method (Wiśniewski et al, 2014) in BaF3‐EpoR and mCFU‐E cells. Diagonal line as guide to the eye. Spearman's rank‐based coefficient of correlation ρ = 0.88.
Protein abundance of key signaling components was determined by mass spectrometry of whole cell lysates of hCFU‐E cells. Copy numbers of proteins per cell were obtained by the “proteomic ruler” method and converted to cytoplasmic concentrations with the volumes calculated from (B) and shown in (C).
Model prediction and experimental validation of proliferation upon single or combined inhibitor treatment with AKT VIII and U0126 upon 5 U/ml Epo stimulation. Maximum proliferation was scaled to 1. Proliferation was measured as cell numbers, counted with a hemocytometer after 96 h by trypan blue exclusion assay. Solid lines represent model trajectories. Experimental data are represented as mean ± standard deviation. N = 3.
Comparison of the effect of single or combinatorial inhibitor treatment on Epo‐induced proliferation of murine and human CFU‐E cells. Proliferation was measured upon single or combined inhibitor treatment with AKT VIII and U0126 upon 5 U/ml Epo stimulation. Numbers of mCFU‐E cells were determined with the Coulter Counter after 14 h, whereas numbers of hCFU‐E cells were determined with a hemocytometer after 96 h by the trypan blue exclusion assay. Maximum proliferation was scaled to 1. Data are represented as mean (N = 3), and error bars indicate standard deviation. Data of mCFU‐E cells are presented in Figs 6D and 7B, and data of hCFU‐E cells are taken from Fig 8F. Tukey multiple comparison of means, n.s. = not significant, *P < 0.05.
Similar articles
-
Gab1 transduces PI3K-mediated erythropoietin signals to the Erk pathway and regulates erythropoietin-dependent proliferation and survival of erythroid cells.Cell Signal. 2009 Dec;21(12):1775-83. doi: 10.1016/j.cellsig.2009.07.013. Epub 2009 Aug 6. Cell Signal. 2009. PMID: 19665053
-
Erythropoietin-induced activation of the JAK2/STAT5, PI3K/Akt, and Ras/ERK pathways promotes malignant cell behavior in a modified breast cancer cell line.Mol Cancer Res. 2010 Apr;8(4):615-26. doi: 10.1158/1541-7786.MCR-09-0264. Epub 2010 Mar 30. Mol Cancer Res. 2010. PMID: 20353997
-
Indoxyl sulfate counteracts endothelial effects of erythropoietin through suppression of Akt phosphorylation.Circ J. 2013;77(5):1326-36. doi: 10.1253/circj.cj-12-0884. Epub 2013 Jan 19. Circ J. 2013. PMID: 23337206
-
Erythropoietin protects pancreatic β-cell line NIT-1 cells against cytokine-induced apoptosis via phosphatidylinositol 3-kinase/Akt signaling.Endocr Res. 2011;36(1):25-34. doi: 10.3109/07435800.2010.534753. Endocr Res. 2011. PMID: 21226565
-
AKT and ERK dual inhibitors: The way forward?Cancer Lett. 2019 Sep 10;459:30-40. doi: 10.1016/j.canlet.2019.05.025. Epub 2019 May 23. Cancer Lett. 2019. PMID: 31128213 Review.
Cited by
-
Parasympathetic Effect Induces Cell Cycle Activation in Upper Limbs of Paraplegic Patients with Spinal Cord Injury.Int J Mol Sci. 2019 Nov 27;20(23):5982. doi: 10.3390/ijms20235982. Int J Mol Sci. 2019. PMID: 31783707 Free PMC article.
-
Heme-regulated eIF2α kinase in erythropoiesis and hemoglobinopathies.Blood. 2019 Nov 14;134(20):1697-1707. doi: 10.1182/blood.2019001915. Blood. 2019. PMID: 31554636 Free PMC article. Review.
-
Short-term cellular memory tunes the signaling responses of the chemokine receptor CXCR4.Sci Signal. 2019 Jul 9;12(589):eaaw4204. doi: 10.1126/scisignal.aaw4204. Sci Signal. 2019. PMID: 31289212 Free PMC article.
-
Linking patient-specific basal MET phosphorylation levels to liver health.Mol Syst Biol. 2024 Mar;20(3):141-143. doi: 10.1038/s44320-024-00023-y. Epub 2024 Feb 16. Mol Syst Biol. 2024. PMID: 38365957 Free PMC article.
-
Somatostatin Primes Endothelial Cells for Agonist-Induced Hyperpermeability and Angiogenesis In Vitro.Int J Mol Sci. 2022 Mar 13;23(6):3098. doi: 10.3390/ijms23063098. Int J Mol Sci. 2022. PMID: 35328517 Free PMC article.
References
-
- van den Akker E, van Dijk T, Parren‐van Amelsvoort M, Grossmann KS, Schaeper U, Toney‐Earley K, Waltz SE, Löwenberg B, von Lindern M (2004) Tyrosine kinase receptor RON functions downstream of the erythropoietin receptor to induce expansion of erythroid progenitors. Blood 103: 4457–4465 - PubMed
Publication types
MeSH terms
Substances
LinkOut - more resources
Full Text Sources
Other Literature Sources
Molecular Biology Databases
Research Materials
Miscellaneous
