

SWATH-based proteomics identified carbonic anhydrase 2 as a potential diagnosis biomarker for nasopharyngeal carcinoma
- PMID: 28117408
- PMCID: PMC5259699
- DOI: 10.1038/srep41191
SWATH-based proteomics identified carbonic anhydrase 2 as a potential diagnosis biomarker for nasopharyngeal carcinoma
Abstract
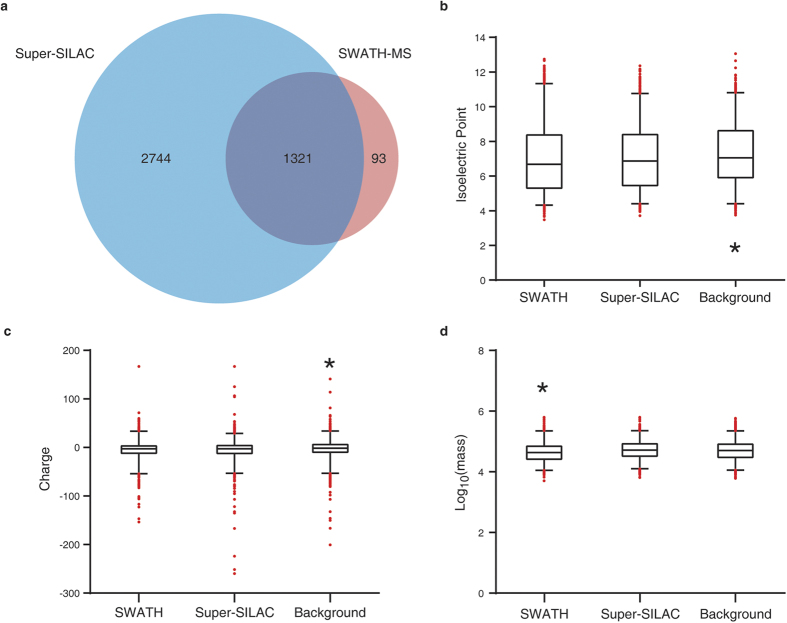
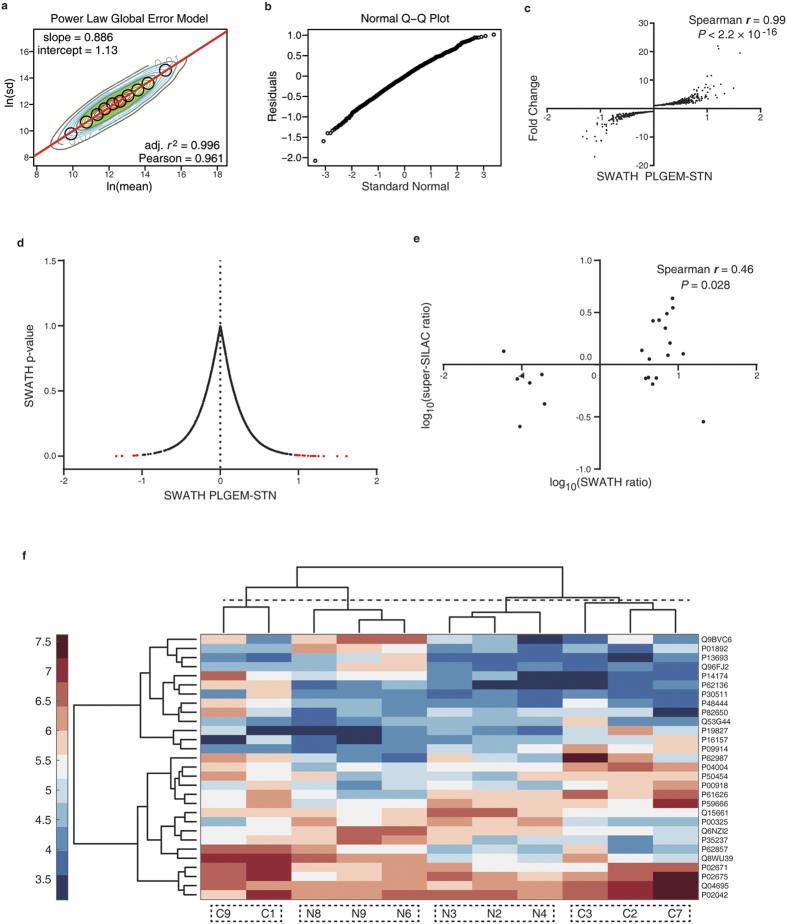
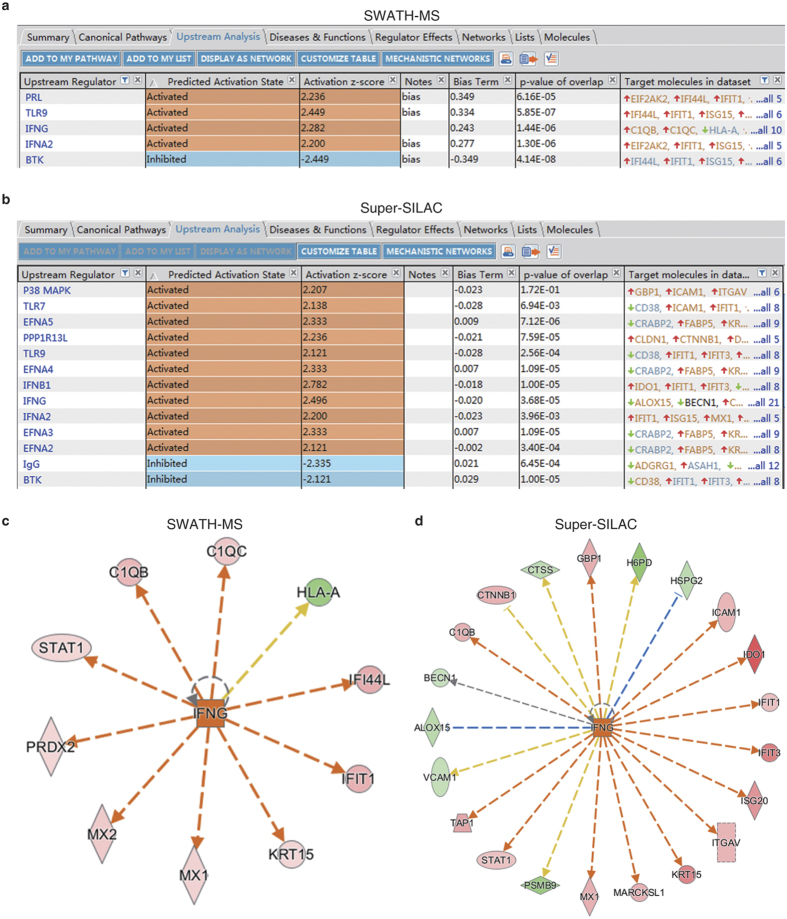
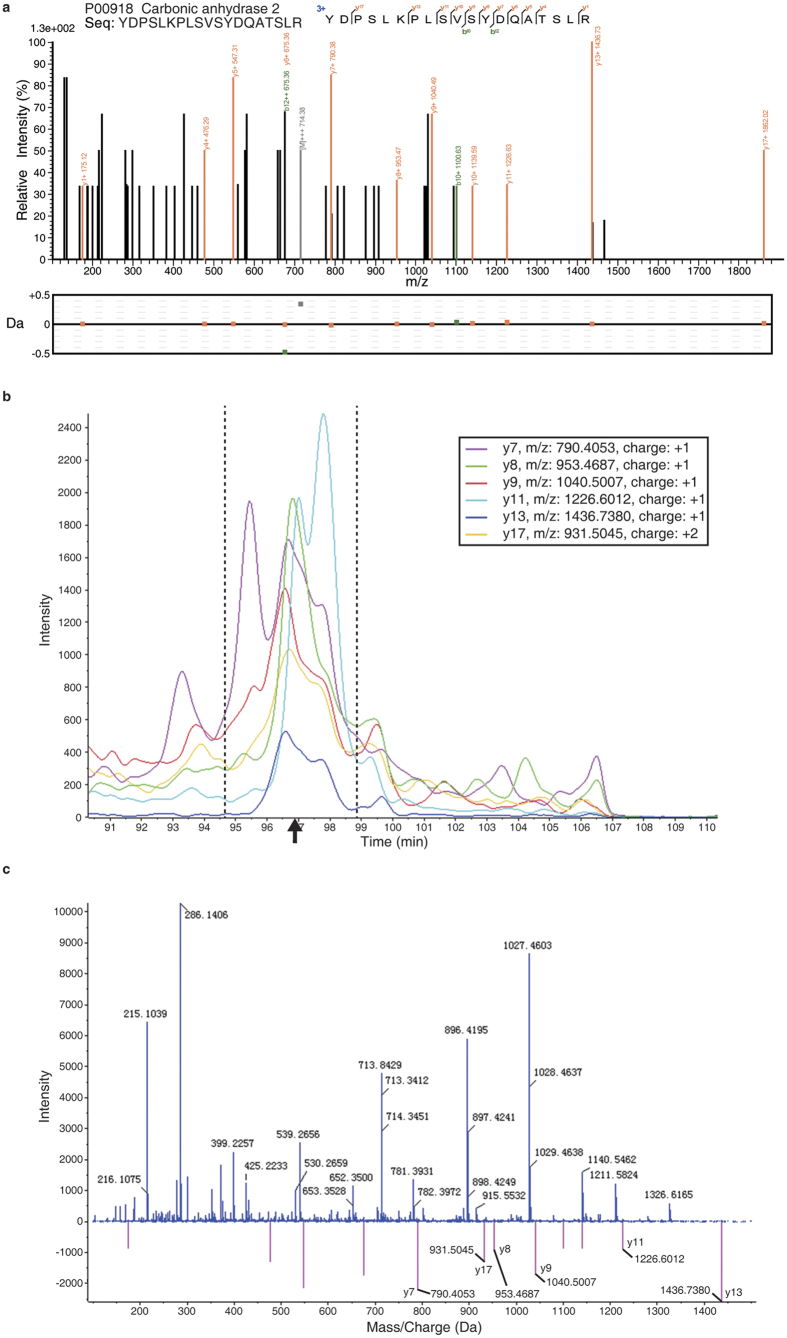
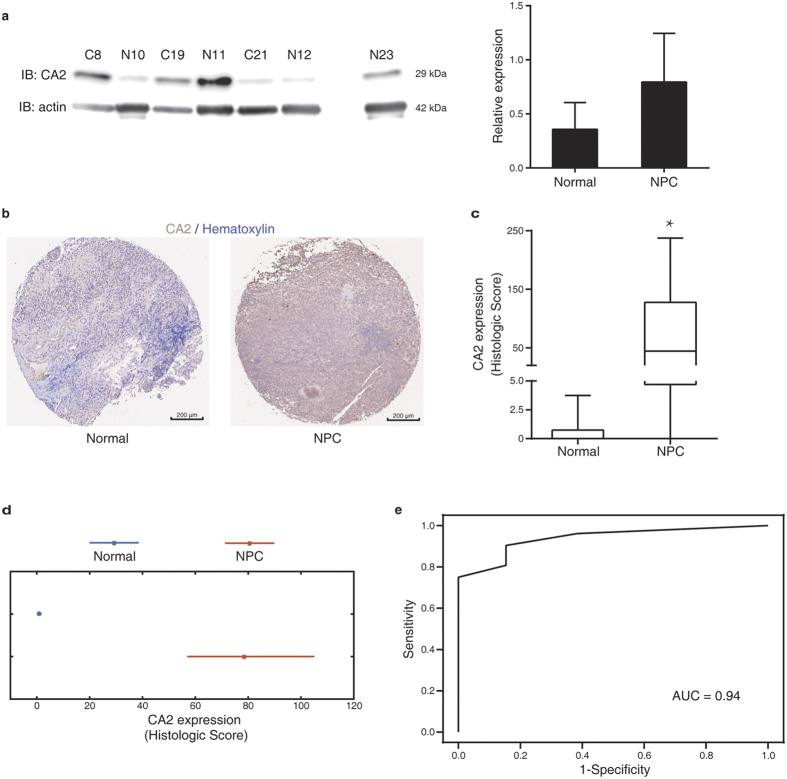
Nasopharyngeal carcinoma (NPC) is a serious threat to public health, and the biomarker discovery is of urgent needs. The data-independent mode (DIA) based sequential window acquisition of all theoretical fragment-ion spectra (SWATH) mass spectrometry (MS) has been proved to be precise in protein quantitation and efficient for cancer biomarker researches. In this study, we performed the first SWATH-MS analysis comparing the NPC and normal tissues. Spike-in stable isotope labeling by amino acids in cell culture (super-SILAC) MS was used as a shotgun reference. We identified and quantified 1414 proteins across all SWATH-MS analyses. We found that SWATH-MS had a unique feature to preferentially detect proteins with smaller molecular weights than either super-SILAC MS or human proteome background. With SWATH-MS, 29 significant differentially express proteins (DEPs) were identified. Among them, carbonic anhydrase 2 (CA2) was selected for further validation per novelty, MS quality and other supporting rationale. With the tissue microarray analysis, we found that CA2 had an AUC of 0.94 in differentiating NPC from normal tissue samples. In conclusion, SWATH-MS has unique features in proteome analysis, and it leads to the identification of CA2 as a potentially new diagnostic biomarker for NPC.
Figures
Similar articles
-
Identification of nasopharyngeal carcinoma metastasis-related biomarkers by iTRAQ combined with 2D-LC-MS/MS.Oncotarget. 2016 Jun 7;7(23):34022-37. doi: 10.18632/oncotarget.9067. Oncotarget. 2016. PMID: 27145374 Free PMC article.
-
Identification of the differentially expressed proteins in nasopharyngeal carcinoma by proteomics.Transl Cancer Res. 2020 Jan;9(1):21-29. doi: 10.21037/tcr.2019.11.14. Transl Cancer Res. 2020. PMID: 35117154 Free PMC article.
-
Biomarker discovery of nasopharyngeal carcinoma by proteomics.Expert Rev Proteomics. 2014 Apr;11(2):215-25. doi: 10.1586/14789450.2014.897613. Epub 2014 Mar 10. Expert Rev Proteomics. 2014. PMID: 24611579 Review.
-
Proteome profiling of Epstein-Barr virus infected nasopharyngeal carcinoma cell line: identification of potential biomarkers by comparative iTRAQ-coupled 2D LC/MS-MS analysis.J Proteomics. 2011 Apr 1;74(4):567-76. doi: 10.1016/j.jprot.2011.01.017. Epub 2011 Feb 4. J Proteomics. 2011. PMID: 21296196
-
A Review: Proteomics in Nasopharyngeal Carcinoma.Int J Mol Sci. 2015 Jul 8;16(7):15497-530. doi: 10.3390/ijms160715497. Int J Mol Sci. 2015. PMID: 26184160 Free PMC article. Review.
Cited by
-
Detection of Circulating Serum Protein Biomarkers of Non-Muscle Invasive Bladder Cancer after Protein Corona-Silver Nanoparticles Analysis by SWATH-MS.Nanomaterials (Basel). 2021 Sep 13;11(9):2384. doi: 10.3390/nano11092384. Nanomaterials (Basel). 2021. PMID: 34578700 Free PMC article.
-
Biophysical, Biochemical, and Cell Based Approaches Used to Decipher the Role of Carbonic Anhydrases in Cancer and to Evaluate the Potency of Targeted Inhibitors.Int J Med Chem. 2018 Jul 16;2018:2906519. doi: 10.1155/2018/2906519. eCollection 2018. Int J Med Chem. 2018. PMID: 30112206 Free PMC article. Review.
-
Apoptosis Effects of Oxalis corniculata L. Extract on Human MCF-7 Breast Cancer Cell Line:Galen Med J. 2022 Nov 16;11:e2484. doi: 10.31661/gmj.v11i.2484. eCollection 2022. Galen Med J. 2022. PMID: 36698692 Free PMC article.
-
Proteomic Analysis in Morquio A Cells Treated with Immobilized Enzymatic Replacement Therapy on Nanostructured Lipid Systems.Int J Mol Sci. 2019 Sep 18;20(18):4610. doi: 10.3390/ijms20184610. Int J Mol Sci. 2019. PMID: 31540344 Free PMC article.
-
Clinical biomarker discovery by SWATH-MS based label-free quantitative proteomics: impact of criteria for identification of differentiators and data normalization method.J Transl Med. 2019 May 31;17(1):184. doi: 10.1186/s12967-019-1937-9. J Transl Med. 2019. PMID: 31151397 Free PMC article.
References
-
- Sun Y. et al.. Induction chemotherapy plus concurrent chemoradiotherapy versus concurrent chemoradiotherapy alone in locoregionally advanced nasopharyngeal carcinoma: a phase 3, multicentre, randomised controlled trial. Lancet Oncol 17, 1509–1520, doi: 10.1016/S1470-2045(16)30410-7 (2016). - DOI - PubMed
Publication types
MeSH terms
Substances
LinkOut - more resources
Full Text Sources
Other Literature Sources
Miscellaneous
