. 2017 Jan 24:7:41123.
doi: 10.1038/srep41123.

NLRP3 inflammasome: Pathogenic role and potential therapeutic target for IgA nephropathy

Affiliations

NLRP3 inflammasome: Pathogenic role and potential therapeutic target for IgA nephropathy

Yu-Ling Tsai et al. Sci Rep. .

Abstract

We have previously showed that IL-1β is involved in the pathogenesis of both spontaneously occurring and passively induced IgA nephropathy (IgAN) models. However, the exact causal-relationship between NLRP3 inflammasome and the pathogenesis of IgAN remains unknown. In the present study, we showed that [1] IgA immune complexes (ICs) activated NLRP3 inflammasome in macrophages involving disruption of mitochondrial integrity and induction of mitochondrial ROS, bone marrow-derived dendritic cells (BMDCs) and renal intrinsic cells; [2] knockout of NLRP3 inhibited IgA ICs-mediated activation of BMDCs and T cells; and [3] knockout of NLRP3 or a kidney-targeting delivery of shRNA of NLRP3 improved renal function and renal injury in a mouse IgAN model. These results strongly suggest that NLRP3 inflammasome serves as a key player in the pathogenesis of IgAN partly through activation of T cells and mitochondrial ROS production and that a local, kidney-targeting suppression of NLRP3 be a therapeutic strategy for IgAN.


Figures
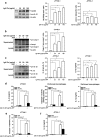
Figure 1
Figure 1. NLRP3 inflammasome activation in IgA ICs-primed macrophages.
NLRP3 and pro-IL-1β levels by Western blotting after incubated for 6 h with IgA ICs and semi-quantitative analysis in J774A.1 macrophages (a). Caspase-1 levels by Western blotting and semi-quantitative analysis (b), and IL-1β levels by Western blotting and semi-quantitative analysis and ELISA (c) in J774A.1 macrophages were incubated for 5.5 h with IgA ICs and 30 min ATP. IL-1β secretion or caspase-1 activity measured by ELISA in shSC or shNLRP3 J774A.1 macrophages and/or primary peritoneal macrophages from untreated wild type or NLRP3 KO mice, which were incubated for 5.5 h with IgA ICs and 30 min ATP (d). Caspase-11 mRNA levels in cell lysate measured by real-time PCR (e) and IL-1β secretion by ELISA (f) in shSC or shcaspase-11 J774A.1 macrophages incubated for 5.5 h with IgA ICs and 30 min ATP. The data are expressed as the mean ± SEM for three separate experiments. *p < 0.05. WT, wild type. IgA ICs, IgA immune complexes. ns, no significant difference.
Figure 2
Figure 2. NLRP3 inflammasome activation in IgA ICs-primed dendritic cells.
TNF-α secretion measured by ELISA, expression levels of CD40+ and CD86+ (within gated CD11c+ cells; the gray-filled area created by staining with an isotype-matched control antibody) determined by flow cytometry in BMDCs from untreated wild type or NLRP3 KO mice, which were incubated for 24 h with IgA ICs (a). IL-1β secretion measured by ELISA in BMDCs from untreated wild type or NLRP3 KO mice, which were incubated for 24 h with IgA ICs and 30 min ATP (b). T cell proliferation was measured by [3 H]-thymidine, and secretion of IFN-γ, IL-17A and IL-4 by ELISA at the indicated ratio of BMDCs:T cells for 3 days, in which BMDCs were incubated for 24 h with IgA ICs and cocultured with OT-II CD4+ T cell pulsed with OVA peptide (c). The data are expressed as the mean ± SEM for three separate experiments. *p < 0.05. WT, wild type. #Not detectable. BMDCs, bone marrow derived dendritic cells. IgA ICs, IgA immune complexes.
Figure 3
Figure 3. ROS production and mitochondrial homeostasis in IgA ICs-primed macrophages.
ROS levels measured by 2′, 7′-dichlorofluorescein diacetate after incubated for 0–80 min with IgA ICs (a). NLRP3 and pro-IL-1β levels by Western blotting after incubated for 6 h with IgA ICs (b), caspase-1 activation (c) and IL-1β secretion (d) by ELISA after incubated for 5.5 h with IgA ICs and 30 min ATP in J774A.1 macrophages pre-incubated for 30 min with or without NAC. Mitochondrial ROS levels by MitoSOX after incubated for 5 min with IgA ICs and 30 min ATP, and mitochondrial DNA release into the cytosol by real-time RCR after incubated for 5.5 h with IgA ICs and 30 min ATP in J774A.1 macrophages pre-incubated for 30 min with or without mito-TEMPO (e). NLRP3 and pro-IL-1β levels were analyzed by Western blotting after incubated for 6 h with IgA ICs (f), and IL-1β secretion by ELISA after incubated for 5.5 h with IgA ICs and 30 min ATP (g) in J774A.1 macrophages pre-incubated for 30 min with or without mito-TEMPO. The data are expressed as the mean ± SEM for three separate experiments. *p < 0.05; **p < 0.001. #Not detectable. IgA ICs, IgA immune complexes. NAC, N-acetyl-L-cysteine. ns, no significant difference.
Figure 4
Figure 4. NLRP3 inflammasome activation in IgA ICs-primed renal intrinsic cells.
Caspase-1 activity (a) and IL-1β secretion (b) measured by ELISA in glomerular primary MCs from untreated wild type or NLRP3 KO mice, which were incubated for 24 h with IgA ICs and 30 min ATP. Caspase-1 activity (c) and IL-1β secretion (d) measured by ELISA in renal TECs, which were incubated for 24 h with IgA ICs and 30 min ATP. The data are expressed as the mean ± SEM for three separate experiments. *p < 0.05. WT, wild type. ns, no significant difference. MCs, mesangial cells. TECs, tubular epithelial cells. IgA ICs, IgA immune complexes.
Figure 5
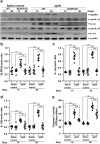
Figure 5. Renal NLRP3 inflammasome activation in wild type or NLRP3 KO mice with IgAN.
Representative Western blots of NLRP3, IL-1β, or IL-18 levels in kidney tissues on day 14 and day 36, β-actin was used as the loading control (a); semi-quantification of the NLRP3/β-actin ratio (b), IL-1β/β-actin ratio (c), or IL-18/β-actin ratio (d). Renal caspase 1 activity (e). The data are expressed as the mean ± SEM for 7 mice per group. **p < 0.01; ***p < 0.005. WT, wild type. ns, no significant difference.
Figure 6
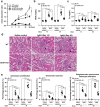
Figure 6. Albuminuria, renal function, and renal pathology in wild type or NLRP3 KO mice with IgAN.
Time-course study of the urine albumin and Cr ratio (a); BUN levels (b); serum Cr levels (c). Kidney histopathology (H&E staining) (d) on the indicated days, arrow indicates periglomerular mononuclear leukocyte infiltration, original magnification, 400x. Renal lesion scores (e). The data are expressed as the mean ± SEM for 7 mice per group. *p < 0.05; **p < 0.01; ***p < 0.005. WT, wild type. #Not detectable. ns, no significant difference.
Figure 7
Figure 7. Infiltration of macrophages, DCs, or T cells of the kidney in wild type or NLRP3 KO mice with IgAN.
F4/80+ macrophages (a), CD11c+ DCs (b), or CD3+ T cells (c) detected by immunohistochemistry, arrow indicates positive staining, original magnification, 400x; Scoring of stained cells in the glomerulus and periglomerular region (d-f). The data are expressed as the mean ± SEM for 7 mice per group. *p < 0.05; **p < 0.01; ***p < 0.005. WT, wild type. #Not detectable. ns, no significant difference. gcs, glomerular cross section.
Figure 8
Figure 8. Memory T cells, CD4+ IL-17A+ T cells, and Treg cells of the spleen in wild type or NLRP3 KO mice with IgAN.
Numbers of CD44hi CD62Llo-hi in CD4+ (a) or CD8+ T cells (b). Percentage of CD4+ T cells expressing IL-17A+ (c). Percentage of CD4+D25+ FoxP3+ Treg cells (d). The data are expressed as the mean ± SEM for 7 mice per group. *p < 0.05; **p < 0.01; ***p < 0.005. WT, wild type. ns, no significant difference.
Figure 9
Figure 9. Determination of renal shNLRP3-luciferase activity by ultrasound-mediated microbubble gene delivery into mice.
Luciferase activity in shNLRP3-luciferase mice measured each day after transfection with shNLRP3-luciferase by ultrasound-mediated microbubble gene delivery and an IVIS system. The ultrasound treatment was performed toward the right side of the back of the mice. The data are expressed as the mean ± SEM for 7 mice per group.
Figure 10
Figure 10. Kidney-targeting shNLRP3 delivery into mice before induction of IgAN.
Urine albumin and Cr ratio on days 0, 7, 14, 28, and 36 (a), serum levels of BUN and Cr on day 36 (b). Kidney histopathology on day 36 [H&E staining] and F4/80+ macrophages and CD3+ T cells [IHC] (c), original magnification, 400x; arrow indicates periglomerular mononuclear leukocyte infiltration or positive staining. Renal lesion scores and scoring of stained cells in the glomerulus and periglomerular region on day 36 (d), NLRP3, IL-1β, and IL-18 protein levels on day 36 (e), a typical result and the semiquantitative analysis for NLRP3, IL-1β, or IL-18 (f), and renal caspase-1 activity (g). The data are expressed as the mean ± SEM for 7 mice per group. *p < 0.05; **p < 0.01; ***p < 0.005. #Not detectable. ns, no significant difference. gcs, glomerular cross section.
Figure 11
Figure 11. Kidney-targeting shNLRP3 delivery into mice after induction of IgAN.
Urine albumin and Cr ratio on days 0, 7, 14, 28, and 36 (a), serum levels of BUN and Cr on day 36 (b). Kidney histopathology on day 36 [H&E staining] and F4/80+ macrophages and CD3+ T cells[IHC] (c), original magnification, 400x; arrow indicates periglomerular mononuclear leukocyte infiltration or positive staining. Renal lesion scores and scoring of stained cells in the glomerulus and periglomerular region on day 36 (d). The data show the mean ± SEM for results with 7 mice per group. *p < 0.05; **p < 0.01;***p < 0.005. #Not detectable. ns, no significant difference. gcs, glomerular cross section.

Similar articles

Cited by

References

    1. Zhu J., Wang H. & Yang D. IgA nephropathy with pathologic features of membranoproliferative glomerulonephritis following burn injury. Case Rep. Nephrol. Urol. 4, 31–36 (2014). - PMC - PubMed
    1. Silva G. E. et al.. Renal macrophage infiltration is associated with a poor outcome in IgA nephropathy. Clinics (Sao Paulo) 67, 697–703 (2012). - PMC - PubMed
    1. Rifai A. & Dworkin L. D. IgA nephropathy: markers of progression and clues to pathogenesis. Kidney Int. 73, 1338–1340 (2008). - PubMed
    1. Pei G. et al.. Renal interstitial infiltration and tertiary lymphoid organ neogenesis in IgA nephropathy. Clin. J. Am. Soc. Nephrol. 9, 255–264 (2014). - PMC - PubMed
    1. Kim J. K. et al.. Clinical features and outcomes of IgA nephropathy with nephrotic syndrome. Clin. J. Am. Soc. Nephrol. 7, 427–36 (2012). - PMC - PubMed

Publication types

Substances

LinkOut - more resources