. 2017 Feb 7;114(6):E990-E998.
doi: 10.1073/pnas.1615758114. Epub 2017 Jan 23.

Induction of dormancy in hypoxic human papillomavirus-positive cancer cells

Affiliations

Induction of dormancy in hypoxic human papillomavirus-positive cancer cells

Karin Hoppe-Seyler et al. Proc Natl Acad Sci U S A. .

Abstract

Oncogenic human papillomaviruses (HPVs) are closely linked to major human malignancies, including cervical and head and neck cancers. It is widely assumed that HPV-positive cancer cells are under selection pressure to continuously express the viral E6/E7 oncogenes, that their intracellular p53 levels are reconstituted on E6/E7 repression, and that E6/E7 inhibition phenotypically results in cellular senescence. Here we show that hypoxic conditions, as are often found in subregions of cervical and head and neck cancers, enable HPV-positive cancer cells to escape from these regulatory principles: E6/E7 is efficiently repressed, yet, p53 levels do not increase. Moreover, E6/E7 repression under hypoxia does not result in cellular senescence, owing to hypoxia-associated impaired mechanistic target of rapamycin (mTOR) signaling via the inhibitory REDD1/TSC2 axis. Instead, a reversible growth arrest is induced that can be overcome by reoxygenation. Impairment of mTOR signaling also interfered with the senescence response of hypoxic HPV-positive cancer cells toward prosenescent chemotherapy in vitro. Collectively, these findings indicate that hypoxic HPV-positive cancer cells can induce a reversible state of dormancy, with decreased viral antigen synthesis and increased therapeutic resistance, and may serve as reservoirs for tumor recurrence on reoxygenation.

Keywords: cervical cancer; human papillomavirus; hypoxia; mTOR; tumor virus.


Conflict of interest statement

The authors declare no conflict of interest.

Figures
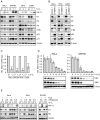
Fig. 1.
Fig. 1.
Repression of HPV E6/E7 oncogene expression under hypoxia. (A) HPV18-positive HeLa and SW756 cells and HPV16-positive SiHa and CaSki cells were cultured for 24 h at the indicated O2 concentrations. Shown are immunoblots of HIF-1α (hypoxia-linked marker), HPV16/18 E6, HPV16/18 E7, total Rb, phosphorylated Rb (P-Rb; Ser807/811), p53, and p21 protein expression. β-actin served as a loading control. (B) Normoxic cells were transfected with E6/E7-targeting siRNAs (si16E6/E7 or si18E6/E7) or control siRNA (siContr-1), and protein expression was analyzed by immunoblotting. (C) E6/E7 mRNA expression under normoxia (21% O2) or hypoxia (1% O2). Indicated are the mean E6/E7 transcript levels of at least five independent experiments measured by qRT-PCR after 24 h under hypoxia, for each cell line relative to the corresponding E6/E7 transcript levels under normoxia (set at 1.0). SDs are indicated. Asterisks above columns indicate statistically significant differences from normoxic cells (***P < 0.001). (D) Time course of hypoxia-linked E6/E7 repression. (Upper) Measurements of transcript levels by qRT-PCR. SDs of technical replicates are indicated (n = 3). (Lower) Accompanying analyses of protein levels by immunoblot. β-actin served as a loading control. (E) HPV-positive cancer cells were grown in medium containing 0 mM, 5.5 mM, or 25 mM glucose. The presence (+) or absence (−) of FCS in the medium is indicated. Cells were cultured under normoxia (21% O2) or hypoxia (1% O2). Shown are immunoblots of HPV16/18 E6, HPV16/18 E7, and HIF-1α levels. β-actin served as a loading control.
Fig. S1.
Fig. S1.
E6/E7 repression is not linked to HIF-1α or HIF-2α expression. (Upper, Left) Immunoblot analyses investigating the effects of the HIF agonists CoCl2, mimosine, or DMOG on E7 levels in normoxic HeLa cells. (Upper, Center and Right) Analyses of the effects of shRNAs blocking HIF-1α (shHIF-1α-1, shHIF-1α-2) or HIF-2α (shHIF-2α-1, shHIF-2α-2) expression, respectively, on hypoxia-linked E7 repression. (Lower) Analyses of the effects of pooled shRNAs blocking HIF-1α (shHIF-1α) or HIF-2α (shHIF-2α), applied either alone or in combination, on hypoxia-linked E6 and E7 repression. β-actin served as a loading control.
Fig. S2.
Fig. S2.
p53 regulation under hypoxia. (A) HeLa and SiHa cells were cultivated under normoxia (21% O2) or hypoxia (1% O2). Shown are the mean p53 transcript levels measured by qRT-PCR after 24 h under hypoxia for each cell line relative to the corresponding p53 transcript levels under normoxia (set at 1.0). SDs of biological replicates are indicated (n = 4), n.s., statistically not significant. (B) HPV18-positive HeLa, HPV16-positive SiHa, and HPV-negative HCT116 cells were cultivated for 24 h under normoxia (21% O2) or hypoxia (1% O2), in either the absence (−) or the presence (+) of 10 μM Nutlin-3. Shown are immunoblots of p53 and HPV16/18 E7 protein levels. β-actin served as a loading control. n.d., not determined.
Fig. 2.
Fig. 2.
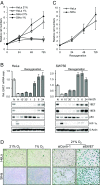
Hypoxia-induced growth inhibition and E6/E7 repression are reversible on reoxygenation. (A) HeLa and SiHa cells were cultured for the indicated time periods at 21% O2 or at 1% O2, and relative cell numbers were determined. For each cell line, initial cell numbers (time point 0) were set at 1.0. SDs of biological replicates are indicated (n = 4). (B, Upper) qRT-PCR analyses of E6/E7 mRNA levels under normoxia (N; 21% O2) and hypoxia (H; 1% O2) (bright columns), and on reoxygenation of hypoxic cells for the indicated time periods (dark columns). SDs of technical replicates are indicated (n = 3). (B, Lower) Accompanying immunoblot analyses of E6, E7, p53, and HIF-1α levels. β-actin served as a loading control. (C) Cells were incubated for 72 h at 1% O2. Subsequently (time point 0), the cells were cultured at 21% O2 for the indicated time periods, and cell numbers were determined. SDs of biological replicates are indicated (n = 3). (D, Left) Cells were cultured under normoxia (21% O2) or hypoxia (1% O2) for 72 h and the stained for expression of the senescence marker SA-β-Gal. (Scale bar: 200 µm.) (D, Right) Cells were cultured under normoxia, endogenous E6/E7 expression was silenced by RNAi, and cells were stained for SA-β-Gal expression at 72 h after transfection.
Fig. S3.
Fig. S3.
E6/E7 inhibitory siRNAs do not induce senescence in hypoxic HPV-positive cancer cells. HeLa cells were transfected with E6/E7 inhibitory siRNAs (si18E6/E7) or control siRNA (siContr-1) and cultivated under normoxia (21% O2) or hypoxia (1% O2). After 72 h, cells were stained for expression of the senescence marker SA-β-Gal. (Scale bar: 200 µm.)
Fig. 3.
Fig. 3.
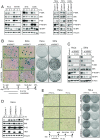
Senescence induction on E6/E7 repression in HPV-positive cancer cells depends on mTOR signaling, which is impaired under hypoxia. (A, Left) Cells were cultured under different O2 concentrations, as indicated. Immunoblot analyses of phosphorylated S6K (P-S6K), total S6K (S6K), phosphorylated S6 (P-S6), phosphorylated 4E-BP1 (P-4E-BP1) and total 4E-BP1 (4E-BP1). Vinculin served as a loading control. (A, Right) Immunoblot analyses of mTOR substrates on RNAi-mediated E6/E7 repression in normoxic HPV-positive cancer cells. (B, Left) Senescence assays (SA-β-Gal staining), in the absence (−) or the presence of the mTOR inhibitors rapamycin or KU-0063794. (Scale bar: 200 µm.) (B, Right) Colony-formation assays of HPV-positive cancer cells, in the absence (−) or presence of rapamycin or KU-0063794. Colonies were visualized with crystal violet. Scheme below: Treatment protocol, further detailed in the text. Tx, transfection. (C) Normoxic HPV-positive cancer cells were transfected with E6/E7-inhibitory siRNAs in either the absence (−) or presence of rapamycin (R) or KU-0063794 (KU). The levels of HPV16/18 E6 and E7, P-S6K, S6K, P-4E-BP1, and 4E-BP1 were determined by immunoblotting. siContr-1, control siRNA. β-actin served as a loading control. (D) HeLa cells expressing shREDD1-1, shREDD1-2, or shTSC2-1 were cultured at 21% or 1% O2 for 24 h, after which levels of P-S6K, S6K, P-S6 and HPV18 E7 were determined by immunoblotting. Vinculin served as a loading control. (E) HeLa cells were transfected with shRNA expression vectors for shREDD1-1, shREDD1-2, or shTSC2-1 and cultured under normoxia or hypoxia. (Left) Senescence assays (SA-β-Gal staining) of cells subsequently cultured under normoxia. (Scale bar: 200 µm.) (Right) Corresponding CFAs. Control cells were transfected with empty vector (pSUPER) or with a vector expressing shContr-1. Scheme below: Treatment protocol, further detailed in the text. Tx, transfection.
Fig. S4.
Fig. S4.
mTOR signaling in hypoxic cells. (A) HeLa cells were cultivated for 16 h under normoxia (21% O2) or hypoxia (1% O2) in cell culture medium containing either 5.5 mM glucose or 25 mM glucose. Shown are immunoblots of HIF-1α, HPV18 E7, P-S6K, S6K, P-S6, and P-4E-BP1 levels. β-actin served as a loading control. (B) A panel of HPV-negative cells was cultivated for 24 h under normoxia (21% O2) or hypoxia (1% O2). Immunoblot analyses of P-S6K (s.e., short exposure; l.e., long exposure), S6K, P-S6, P-4E-BP1, and 4E-BP1 levels. β-actin served as a loading control.
Fig. S5.
Fig. S5.
REDD1 expression under hypoxia and RNAi-mediated repression of REDD1 and TSC2. (A) HeLa cells were grown under normoxia (21% O2) or under hypoxia (1% O2) for 24 h, and REDD1 transcript levels were determined by qRT-PCR. Indicated are relative REDD1 mRNA levels, with REDD1 expression under normoxia set at 1.0. Asterisks above the column indicate statistically significant differences from normoxic cells (**P < 0.01). (B) HeLa cells were transfected with pSUPER vectors expressing shRNAs targeting REDD1 (shREDD1-1, shREDD1-2) or TSC2 (shTSC2-1, shTSC2-2) mRNAs. Indicated are relative REDD1 (Left) and TSC2 (Right) transcript levels at 72 h after transfection compared with cells expressing control shRNA shContr-1 (set at 1.0). SDs of biological replicates are indicated. n ≥3. Asterisks above columns indicate statistically significant differences from control shRNA-treated cells (**P < 0.01; ***P < 0.001). (C) Reconstitution of mTOR signaling on shTSC2-2 expression in hypoxic HeLa cells (experimental details in Fig. 3D). (D) Senescence assays on expression of shTSC2-2 in normoxic and hypoxic HeLa cells (experimental details in Fig. 4E, Left). (E) Senescence assays on expression of shTSC2-2 in etoposide-treated normoxic and hypoxic HeLa cells (experimental details in Fig. 5E, Left). (Scale bar: 200 µm.)
Fig. S6.
Fig. S6.
mTOR modulation and p53 levels. (A) HeLa cells expressing shTSC2-1, shTSC2-2, shREDD1-1, or shREDD1-2 were cultured at 21% or 1% O2 for 24 h. The levels of P-S6K, S6K, HPV18 E7, and p53 were determined by immunoblotting. pSUPER, empty expression vector; β-actin served as a loading control. (B) Normoxic HPV-positive cancer cells were treated for 24 h with 0.5, 1.0, or 5 μM KU-0063794 (KU) or 50 nM rapamycin. Shown are immunoblots of P-S6K, S6K, P-4E-BP1, 4E-BP1, HPV16/18 E6/E7, and p53 protein levels. DMSO served as a solvent control; β-actin, as a loading control.
Fig. 4.
Fig. 4.
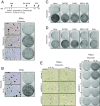
CT-induced senescence in HPV-positive cancer cells depends on mTOR signaling and is counteracted by hypoxia. (A) SiHa cells were treated under normoxia with etoposide, in either the absence (−) or the presence of rapamycin or KU-0063794. (Left) Senescence assays (SA-β-Gal staining). (Scale bar: 200 µm.) (Right) CFAs. Scheme above: Treatment protocol for Fig. 4 A–D, further detailed in the text. (B) SiHa cells were treated for 48 h with etoposide under normoxia or hypoxia, and subsequently cultured under normoxia. (Left) Senescence assays (SA-β-Gal staining). (Scale bar: 200 µm.) (Right) CFAs. (C and D) Normoxic and hypoxic HPV16- and HPV18-positive cancer cell lines were exposed to etoposide (C) or doxorubicin (D) at 21% or 1% O2, and subsequently analyzed by CFAs under normoxia. (E) HeLa cells were transfected with shRNA expression vectors for shREDD1-1, shREDD1-2, or shTSC2-1 and cultured under normoxia or hypoxia. (Left) Senescence assays (SA-β-Gal staining) of cells subsequently cultured under normoxia. (Scale bar: 200 µm.) (Right) Corresponding CFAs. Control cells were transfected with empty vector (pSUPER) or with a vector expressing shContr-1. Treatment protocol corresponds to the scheme indicated in Fig. 3E, but with additional etoposide treatment at days 2–4.
Fig. 5.
Fig. 5.
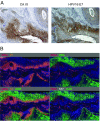
Negative correlation between E7 and CA IX expression in tissue specimens from patients with cervical cancer. (A) Representative immunohistochemical analysis of an HPV16-positive cervical cancer, stained for the expression of the hypoxia-linked marker CA IX and HPV16 E7. (Scale bar: 200 µm.) (B) Multiplex immunofluorescence staining of the tumor depicted in Fig. 5A. Nuclei were counterstained with DAPI (blue). (Upper, Left) Expression of CD34 (red) and E7 (orange). (Upper, Right) Expression of CD34 (red) and CA IX (green). (Lower, Left) Expression of CD34 (red), E7 (orange) and CA IX (green). (Lower, Right) Expression of CD34 (red), CA IX (green) and Ki67 (white). (Scale bar: 100 µm.) Note the autofluorescence of red blood cells in the red channel. See also Fig. S7.
Fig. S7.
Fig. S7.
Multiplex immunofluorescence analysis of an HPV16-positive cervical cancer specimen. (Upper, Left) Expression of CD34 (red) and E7 (orange). (Upper, Right) Expression of CD34 (red) and CA IX (green). (Lower, Left) Expression of CD34 (red), E7 (orange), and CA IX (green). (Lower, Right) Expression of CD34 (red), CA IX (green), and Ki-67 (white). Dotted lines surround CA IX-positive/E7-negative regions in which the expression of Ki-67 is strongly reduced or absent. (Scale bar: 100 µm.)
Fig. 6.
Fig. 6.
Implications of hypoxia-linked alterations in HPV-positive cancer cells. Hypoxia results in E6/E7 repression and inhibition of cellular proliferation of HPV-positive cancer cells. The concomitant interference with mTOR signaling by hypoxia allows the cells to evade senescence. The growth inhibition under hypoxia contributes to the resistance of HPV-positive cancer cells toward CT. The ability of hypoxic HPV-positive cancer cells to block E6/E7 expression without undergoing senescence also provides therapeutic resistance toward strategies aiming at E6/E7 inhibition. The repression of E6/E7 antigen synthesis, together with the immunosuppressive effects of hypoxia, support evasion of hypoxic HPV-positive cancer cells from the host’s immune response and protects against immunotherapeutic approaches targeting E6/E7. Owing to the reversibility of hypoxia-linked growth inhibition, dormant hypoxic HPV-positive cells could serve as a reservoir for tumor recurrence on reoxygenation.

Comment in

Similar articles

Cited by

References

    1. zur Hausen H. Papillomaviruses and cancer: From basic studies to clinical application. Nat Rev Cancer. 2002;2(5):342–350. - PubMed
    1. Howley PM, Schiller JT, Lowy DR. Papillomaviruses. In: Knipe DM, Howley PM, editors. Fields Virology. 6th Ed. Lippincott, Williams & Wilkins; Philadelphia: 2013. pp. 1662–1703.
    1. American Cancer Society . Cancer Facts and Figures 2015. American Cancer Society; Atlanta, GA: 2015.
    1. Goodwin EC, et al. Rapid induction of senescence in human cervical carcinoma cells. Proc Natl Acad Sci USA. 2000;97(20):10978–10983. - PMC - PubMed
    1. Honegger A, et al. Dependence of intracellular and exosomal microRNAs on viral E6/E7 oncogene expression in HPV-positive tumor cells. PLoS Pathog. 2015;11(3):e1004712. - PMC - PubMed

Publication types

MeSH terms

Substances