Association Between Diabetes and Cause-Specific Mortality in Rural and Urban Areas of China
- PMID: 28114552
- PMCID: PMC6520233
- DOI: 10.1001/jama.2016.19720
Association Between Diabetes and Cause-Specific Mortality in Rural and Urban Areas of China
Abstract
Importance: In China, diabetes prevalence has increased substantially in recent decades, but there are no reliable estimates of the excess mortality currently associated with diabetes.
Objectives: To assess the proportional excess mortality associated with diabetes and estimate the diabetes-related absolute excess mortality in rural and urban areas of China.
Design, setting, and participants: A 7-year nationwide prospective study of 512 869 adults aged 30 to 79 years from 10 (5 rural and 5 urban) regions in China, who were recruited between June 2004 and July 2008 and were followed up until January 2014.
Exposures: Diabetes (previously diagnosed or detected by screening) recorded at baseline.
Main outcomes and measures: All-cause and cause-specific mortality, collected through established death registries. Cox regression was used to estimate adjusted mortality rate ratio (RR) comparing individuals with diabetes vs those without diabetes at baseline.
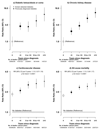
Results: Among the 512 869 participants, the mean (SD) age was 51.5 (10.7) years, 59% (n = 302 618) were women, and 5.9% (n = 30 280) had diabetes (4.1% in rural areas, 8.1% in urban areas, 5.8% of men, 6.1% of women, 3.1% had been previously diagnosed, and 2.8% were detected by screening). During 3.64 million person-years of follow-up, there were 24 909 deaths, including 3384 among individuals with diabetes. Compared with adults without diabetes, individuals with diabetes had a significantly increased risk of all-cause mortality (1373 vs 646 deaths per 100 000; adjusted RR, 2.00 [95% CI, 1.93-2.08]), which was higher in rural areas than in urban areas (rural RR, 2.17 [95% CI, 2.07-2.29]; urban RR, 1.83 [95% CI, 1.73-1.94]). Presence of diabetes was associated with increased mortality from ischemic heart disease (3287 deaths; RR, 2.40 [95% CI, 2.19-2.63]), stroke (4444 deaths; RR, 1.98 [95% CI, 1.81-2.17]), chronic liver disease (481 deaths; RR, 2.32 [95% CI, 1.76-3.06]), infections (425 deaths; RR, 2.29 [95% CI, 1.76-2.99]), and cancer of the liver (1325 deaths; RR, 1.54 [95% CI, 1.28-1.86]), pancreas (357 deaths; RR, 1.84 [95% CI, 1.35-2.51]), female breast (217 deaths; RR, 1.84 [95% CI, 1.24-2.74]), and female reproductive system (210 deaths; RR, 1.81 [95% CI, 1.20-2.74]). For chronic kidney disease (365 deaths), the RR was higher in rural areas (18.69 [95% CI, 14.22-24.57]) than in urban areas (6.83 [95% CI, 4.73-9.88]). Among those with diabetes, 10% of all deaths (16% rural; 4% urban) were due to definite or probable diabetic ketoacidosis or coma (408 deaths).
Conclusions and relevance: Among adults in China, diabetes was associated with increased mortality from a range of cardiovascular and noncardiovascular diseases. Although diabetes was more common in urban areas, it was associated with greater excess mortality in rural areas.
Conflict of interest statement
Figures


Comment in
-
China's Burgeoning Epidemic of Diabetes-Associated Mortality.JAMA. 2017 Jan 17;317(3):264-266. doi: 10.1001/jama.2016.19736. JAMA. 2017. PMID: 28114532 No abstract available.
-
Urban-Rural Differences in Diabetes in China.JAMA. 2017 Apr 25;317(16):1688-1689. doi: 10.1001/jama.2017.3347. JAMA. 2017. PMID: 28444269 No abstract available.
Similar articles
-
Contrasting male and female trends in tobacco-attributed mortality in China: evidence from successive nationwide prospective cohort studies.Lancet. 2015 Oct 10;386(10002):1447-56. doi: 10.1016/S0140-6736(15)00340-2. Lancet. 2015. PMID: 26466050 Free PMC article. Review.
-
Association of Blood Pressure With Cause-Specific Mortality in Mexican Adults.JAMA Netw Open. 2020 Sep 1;3(9):e2018141. doi: 10.1001/jamanetworkopen.2020.18141. JAMA Netw Open. 2020. PMID: 32975571 Free PMC article.
-
Chronic disease mortality in rural and urban residents in Hubei Province, China, 2008-2010.BMC Public Health. 2013 Aug 2;13:713. doi: 10.1186/1471-2458-13-713. BMC Public Health. 2013. PMID: 23915378 Free PMC article.
-
Causes and predictors of mortality in Asian Indians with and without diabetes-10 year follow-up of the Chennai Urban Rural Epidemiology Study (CURES - 150).PLoS One. 2018 Jul 9;13(7):e0197376. doi: 10.1371/journal.pone.0197376. eCollection 2018. PLoS One. 2018. PMID: 29985959 Free PMC article.
-
Aspirin Use in Adults: Cancer, All-Cause Mortality, and Harms: A Systematic Evidence Review for the U.S. Preventive Services Task Force [Internet].Rockville (MD): Agency for Healthcare Research and Quality (US); 2015 Sep. Report No.: 13-05193-EF-1. Rockville (MD): Agency for Healthcare Research and Quality (US); 2015 Sep. Report No.: 13-05193-EF-1. PMID: 26491756 Free Books & Documents. Review.
Cited by
-
Urban index and lifestyle risk factors for cardiovascular diseases in China: A cross-sectional study.Sci Prog. 2021 Jan-Mar;104(1):368504211003762. doi: 10.1177/00368504211003762. Sci Prog. 2021. PMID: 33788663 Free PMC article.
-
Influence of type II diabetes mellitus on postoperative complications following colorectal cancer surgery.Exp Ther Med. 2022 Aug 2;24(4):611. doi: 10.3892/etm.2022.11548. eCollection 2022 Oct. Exp Ther Med. 2022. PMID: 36160911 Free PMC article.
-
Sex-specific differences in left ventricular mass and myocardial energetic efficiency in non-diabetic, pre-diabetic and newly diagnosed type 2 diabetic subjects.Cardiovasc Diabetol. 2021 Mar 6;20(1):60. doi: 10.1186/s12933-021-01248-z. Cardiovasc Diabetol. 2021. PMID: 33676510 Free PMC article.
-
Triglyceride to High-Density Lipoprotein Cholesterol (TG/HDL-C) Ratio, a Simple but Effective Indicator in Predicting Type 2 Diabetes Mellitus in Older Adults.Front Endocrinol (Lausanne). 2022 Feb 24;13:828581. doi: 10.3389/fendo.2022.828581. eCollection 2022. Front Endocrinol (Lausanne). 2022. PMID: 35282431 Free PMC article.
-
Diabetes and infectious disease mortality in Mexico City.BMJ Open Diabetes Res Care. 2023 Mar;11(2):e003199. doi: 10.1136/bmjdrc-2022-003199. BMJ Open Diabetes Res Care. 2023. PMID: 36889802 Free PMC article.
References
-
- Pan XR, Yang WY, Li GW, Liu J. Prevalence of diabetes and its risk factors in China, 1994. Diabetes Care. 1997;20:1664–9. - PubMed
-
- Li LM, Rao KQ, Kong LZ, et al. A description on the Chinese national nutrition and health survey in 2002. Chin Epidemiol J. 2005;26:478–84. - PubMed
-
- Yang W, Lu J, Weng J, et al. Prevalence of diabetes among men and women in China. N Engl J Med. 2010;362:1090–101. - PubMed
-
- Xu Y, Wang L, He J, et al. Prevalence and control of diabetes in Chinese adults. JAMA. 2013;310:948–59. - PubMed
Publication types
MeSH terms
Grants and funding
LinkOut - more resources
Full Text Sources
Other Literature Sources
Medical

