. 2017 Mar 16;543(7645):378-384.
doi: 10.1038/nature21386. Epub 2017 Jan 23.

Integrated genomic and molecular characterization of cervical cancer

Cancer Genome Atlas Research NetworkAlbert Einstein College of MedicineAnalytical Biological ServicesBarretos Cancer HospitalBaylor College of MedicineBeckman Research Institute of City of HopeBuck Institute for Research on AgingCanada's Michael Smith Genome Sciences CentreHarvard Medical SchoolHelen F. Graham Cancer Center &Research Institute at Christiana Care Health ServicesHudsonAlpha Institute for BiotechnologyILSbio, LLCIndiana University School of MedicineInstitute of Human VirologyInstitute for Systems BiologyInternational Genomics ConsortiumLeidos BiomedicalMassachusetts General HospitalMcDonnell Genome Institute at Washington UniversityMedical College of WisconsinMedical University of South CarolinaMemorial Sloan Kettering Cancer CenterMontefiore Medical CenterNantOmicsNational Cancer InstituteNational Hospital, Abuja, NigeriaNational Human Genome Research InstituteNational Institute of Environmental Health SciencesNational Institute on Deafness &Other Communication DisordersOntario Tumour Bank, London Health Sciences CentreOntario Tumour Bank, Ontario Institute for Cancer ResearchOntario Tumour Bank, The Ottawa HospitalOregon Health &Science UniversitySamuel Oschin Comprehensive Cancer Institute, Cedars-Sinai Medical CenterSRA InternationalSt Joseph's Candler Health SystemEli &Edythe L. Broad Institute of Massachusetts Institute of Technology &Harvard UniversityResearch Institute at Nationwide Children's HospitalSidney Kimmel Comprehensive Cancer Center at Johns Hopkins UniversityUniversity of BergenUniversity of Texas MD Anderson Cancer CenterUniversity of Abuja Teaching HospitalUniversity of Alabama at BirminghamUniversity of California, IrvineUniversity of California Santa CruzUniversity of Kansas Medical CenterUniversity of LausanneUniversity of New Mexico Health Sciences CenterUniversity of North Carolina at Chapel HillUniversity of Oklahoma Health Sciences CenterUniversity of PittsburghUniversity of São Paulo, Ribeir ão Preto Medical SchoolUniversity of Southern CaliforniaUniversity of WashingtonUniversity of Wisconsin School of Medicine &Public HealthVan Andel Research InstituteWashington University in St Louis
Collaborators

Integrated genomic and molecular characterization of cervical cancer

Cancer Genome Atlas Research Network et al. Nature. .

Abstract

Cervical cancer remains one of the leading causes of cancer-related deaths worldwide. Here we report the extensive molecular characterization of 228 primary cervical cancers, one of the largest comprehensive genomic studies of cervical cancer to date. We observed notable APOBEC mutagenesis patterns and identified SHKBP1, ERBB3, CASP8, HLA-A and TGFBR2 as novel significantly mutated genes in cervical cancer. We also discovered amplifications in immune targets CD274 (also known as PD-L1) and PDCD1LG2 (also known as PD-L2), and the BCAR4 long non-coding RNA, which has been associated with response to lapatinib. Integration of human papilloma virus (HPV) was observed in all HPV18-related samples and 76% of HPV16-related samples, and was associated with structural aberrations and increased target-gene expression. We identified a unique set of endometrial-like cervical cancers, comprised predominantly of HPV-negative tumours with relatively high frequencies of KRAS, ARID1A and PTEN mutations. Integrative clustering of 178 samples identified keratin-low squamous, keratin-high squamous and adenocarcinoma-rich subgroups. These molecular analyses reveal new potential therapeutic targets for cervical cancers.


Conflict of interest statement

Competing Financial Interests:

There are no competing financial interests.

Figures
Extended Data Figure 1
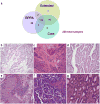
Extended Data Figure 1. Sample sets and histologic patterns of cervical cancer
a, Summary of sample numbers and degree of overlap between the Core, Extended, and RPPA datasets. b, Squamous cell carcinoma of the large cell non-keratinizing type. Tongues of highly atypical polygonal neoplastic squamous cells infiltrate through a fibrotic stroma. The cells show abundant eosinophilic cytoplasm with pleomorphic nuclei and prominent mitotic figures. Although the tumor cells contain abundant cytokeratin filaments, this tumor has traditionally been termed “non-keratinizing” because of the absence of characteristic keratin pearls. c, Squamous cell carcinoma of the large cell keratinizing type. Nests of atypical squamous cells infiltrate through a fibrotic stroma. In addition, this tumor shows highly eosinophilic keratin pearls with small, inky dark nuclei that imperfectly mimic the normal keratinization that is found in the epidermis. This differentiation pattern is aberrant in the cervix in which the squamous epithelium is normally a non-keratinizing squamous mucosa. d, Adenocarcinoma of endocervical type (well-differentiated). Closely set, atypical glands with enlarged nuclei and scattered mitotic figures infiltrate through the connective tissue of the cervix. The tall columnar tumor cells show basally-placed, crowded, enlarged nuclei that show frequent mitotic figures. Compared with normal endocervical cells, the tumor cells show relative loss of intra-cytoplasmic mucin and are frequently called “mucin-depleted,” although most, but not all endocervical adenocarcinomas show varying amounts of intracytoplasmic mucin at least focally. e, Adenosquamous carcinoma of cervix. This tumor shows both nests of non-keratinizing squamous cell carcinoma and glands composed of tall columnar adenocarcinoma reflecting the origin of most cervical cancers in the transformation zone of the cervix in which both squamous and glandular cells normally differentiate. Despite this biphasic differentiation potential, adenosquamous carcinomas are relatively uncommon in the cervix. f, UCEC-like HPV negative adenocarcinoma of endocervical type from a radical hysterectomy specimen. The endometrium in the uterus was benign. g, UCEC-like HPV positive adenocarcinoma of endocervical type from a radical hysterectomy specimen. The endometrium in the uterus was benign. All samples were stained with hematoxylin and eosin (20×).
Extended Data Figure 2
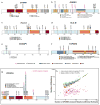
Extended Data Figure 2. Significantly mutated genes and the role of APOBEC in cervical cancer mutagenesis
a–f, High-confidence somatic mutations in significantly mutated genes (SMGs) among 192 exome-sequenced samples in the Extended case set are shown. Domains are labeled in accordance with Gencode 19 corresponding to Ensembl 74. Mutations at canonical intronic splice acceptor (e-1 and e-2) are labeled based on proximity to the nearest coding exon. Panels display somatic mutations detected in novel cervical cancer SMGs, with HLA-B included for comparison with its family member HLA-A. Each axis is the protein-coding portion of a gene and each highlighted section represents the UniProt functional domain. Vertical lines indicate the boundaries of multiple annotation sources within common domain annotations as outlined in Supplemental Table 5. Horizontal lines distinguish overlapping domains. Circles represent a single mutation and are colored based on mutation type. Mutations present in squamous cell carcinomas are outlined in black while those present in adenocarcinomas are outlined in pink. g, PIK3CA mutations and recurrence are shown in a stacked circle plot, as above. Additionally, lolliplot sticks are colored red if the mutation type coincides with patterns of APOBEC mutagenesis. h, The minimal estimated number of APOBEC-induced mutations (“APOBEC_MutLoad_MinEstimate” column in Supplemental Table 1) strongly correlates with total number of mutations in a sample, as well as with the number of single nucleotide variants (SNVs) in G:C pairs which are the exclusive substrate for mutagenesis by APOBEC cytidine deaminases. While correlation with mutagenesis in A:T base pairs, which cannot be mutated by APOBEC enzymes is statistically significant (two-tailed P=0.047), it is very weak. Pearson correlation and R2 were calculated for all 192 exome-sequenced samples, including samples with zero values. Only samples with non-zero values of “APOBEC_MutLoad_MinEstimate” are presented.
Extended Data Figure 3
Extended Data Figure 3. Copy number alterations in cervical cancer
a, Log2-centered heatmap of somatic copy number alterations across 178 Core Set cervical tumors. The x-axis includes samples that have been ordered based on the cluster assignment. The y-axis is based on genomic position, from 1p to Xq. Features associated with copy number clusters are annotated with * or **. *: p<0.05; **: p<0.01. b, GISTIC2.0 amplification and deletion plots within copy number clusters. Chromosomal locations for peaks of significantly recurrent focal amplifications (red, right side) and deletions (blue, left side) are plotted by −LOG10 q-value for the CN High (top) and CN Low (bottom) copy number clusters. Peaks are annotated with cytoband and candidate driver genes. The total number of genes in the peak region is indicated in parenthesis. Peaks with more than 30 genes in the peak region are excluded. Any genes annotated have a significant positive correlation with mRNA expressions. c, Chromosomal locations for peaks of significantly recurrent focal amplifications (red, right side) and deletions (blue, left side) are plotted by −LOG10 q-value for all Core Set samples. Peaks are annotated with cytoband and candidate driver genes. The total number of genes in the peak region is indicated in parentheses. Peaks consisting of more than 30 genes in the peak region are excluded. Annotated genes have a significant positive correlation with mRNA expression. d, Cytolytic activity (CYT) associations with PDL-1/2 amplification. Each bar represents a single tumor and the height of that bar represents the z-score of that tumor’s CYT compared with the rest of the cohort. Bars are colored according to their PD-L1/2 amplification status and sorted from high z-scores to lowest.
Extended Data Figure 4
Extended Data Figure 4. Gene expression patterns and fusion genes found in cervical cancer
a, Hierarchical clustering (uncentered correlation with centroid linkage as the clustering method) was performed on 4,039 expressed and highly variable genes across 178 cervical, 170 endometrial, and 279 head and neck cancer samples. Normalized gene-level RSEM values were median-centered prior to clustering and relative increased expression values are indicated by red color while relative decreased expression values are indicated by blue color. Cervical, endometrial, and head and neck cancer samples are indicated by different colors as noted in the figure at the bottom of the heatmap. Also included are indications of HPV status, histology of cervical and endometrial cancers, and tissue site for head and neck cancer samples. Select genes are noted to the right of their locations on the heatmap. b, Boxplots of the three differentially expressed SMGs and top six significantly differentially expressed non-SMGs across the iCluster groups using Kruskal Wallis test. All genes are significantly different across the Keratin-low and Keratin-high clusters. Significant p-values across Keratin-low and Keratin-high clusters are presented. c, A schematic of BCAR4 tandem duplication in one case (C5-A3HF), detected by analysis of somatic copy number (top) and structural variation (middle). Split reads and genomic breakpoints indicating the tandem duplication are shown. At the RNA level (bottom) the last exon of BCAR4 forms a fusion gene with the first exon of ZC3H7A (red bars indicate location of mRNA breakpoints; NR_024049 shown as BCAR4 representative transcript). d, Schematic of recurrent fusions (CPSF6-C9orf3, ARL8B-ITPR1, and MYH9-TXN2) or fusions with known occurrences in other cancer types (FGFR3-TACC3), detected by at least two RNA-seq fusion callers in 178 samples. Red bars indicate the mRNA breakpoints.
Extended Data Figure 5
Extended Data Figure 5. Unsupervised clusters of DNA methylation data
a, Heatmap showing beta values of 178 Core Set samples ordered by CIMP clusters. Samples are presented in columns and the CpG island promoter CpG loci are presented in rows. An annotation panel on the right of the heatmap indicates CpG loci that are differentially methylated within a particular feature (see Supplemental Table 13). All features (marked with *) are statistically significantly associated with DNA methylation clusters (Fisher’s Exact test p-value <0.01) except APOBEC mutagenesis level, UCEC-like status, and HPV integration status. b, Box plots of the EMT mRNA score and tumor purity by CIMP clusters. Student’s t-test p-value <0.01 (**) and <0.05 (*) are reported.
Extended Data Figure 6
Extended Data Figure 6. miRNA clusters and miR-gene/protein anti-correlations in cervical cancer
a, Unsupervised clustering for miR profiles across 178 Core Set tumor samples. Top to bottom: a normalized abundance heatmap for the fifty 5p or 3p strands that were highly ranked as differentially abundant by a SAMseq multiclass analysis, silhouette width profile calculated from the consensus membership matrix, a heatmap of tumor sample purity, covariates with association p-values, and a summary table of the number of samples in each cluster. The scale bar shows row-scaled log10(RPM+1) normalized abundances. b, Subnetworks of potential targeting relationships for a subset of miRs, as significance-thresholded (FDR<0.05) miR-mRNA and miR-RPPA anti-correlations that are supported by functional validation publications. For genes (nodes), color distinguishes those that are only present in mRNA data (grey) from those that are present in both mRNA and RPPA data (green). Edges represent anti-correlations, and color distinguishes anti-correlations between a miR and mRNA (purple) and a miR and an unphosphorylated protein (green). In the n=178 Core Set cohort, no correlations satisfying FDR<0.05 were reported between a miR and a phosphorylated protein.
Extended Data Figure 7
Extended Data Figure 7. EMT-associated miRs and their relationship to miR clusters and TGFβR2 somatic alterations
a, Normalized miR-200a-3p abundance (RPM) across RPPA clusters for all 112 (top) and 92 squamous (bottom) samples of the Core Set for which RPPA data is available. P-values presented are from two-sided Kolmogorov-Smirnov tests for RPPA-based EMT cluster vs non-EMT cluster samples. For n=112 samples, median miR-200a-3p RPM=296.4 within the EMT cluster (n=29) and 410.0 (n=83) in non-EMT cluster samples. For squamous samples, median miR-200a-3p RPM=296.4 (n=29) within the EMT cluster and 393.4 (n=63) in non-EMT cluster samples. EK-A2R7, which is in the Hormone RPPA cluster, has an RPM value of 4267 and is not shown. Results are not presented for adenocarcinoma samples separately due to limiting sample numbers (n=18 from the Core Set with RPPA data available). b, Negative and positive Spearman correlation coefficients (FDR<0.05) between EMT mRNA score and normalized abundance (RPM) for miRNA mature strands (n=178). miRNAs that have been reported as associated with EMT (see Methods) are highlighted by purple bars. c, Normalized abundance heatmap of miRs most strongly negatively and positively correlated with EMT mRNA scores, with samples grouped by miRNA cluster and sorted by EMT score within each cluster. Somatic mutations (MUT) and deletions (HOMDEL) are shown for TGFBR2, CREBBP, EP300, and SMAD4. Methylation and concomitant downregulated expression alterations (ALT) as defined in Methods for miR-200a/b are also shown. miRs in blue text represent those highlighted by purple bars in b. d–e, Same as b-c, but for the n=144 squamous tumor samples.
Extended Data Figure 8
Extended Data Figure 8. Distinguishing features of cervical cancer integrated molecular subtypes
a, Integrative clustering of 178 cervical cancer Core Set cases using mRNA, methylation, miRNA, and copy number data identified three iClusters: (i) Keratin-low, (ii) Keratin-high, and (iii) Adenocarcinoma-rich (Adenocarcinoma; top feature bar). Relative frequencies of various cervical cancer classifications defined by histology, HPV clade, copy number variation (CNV), methylation, miRNA, and RPPA are plotted. The color key for each feature is presented at the bottom. For each category, the statistically significantly enriched features in each iCluster (chi-squared test; p<0.05) are highlighted with asterisks and a listing of the name of the enriched feature. The width of each plot is scaled according to the number of samples within each cluster. b, The frequencies of somatic alterations and additional novel features that distinguish the iClusters, specifically those that do not occur in all three iClusters, are plotted. The “Somatic Mutations” panel shows the presence/absence of mutations for 7 of the identified significantly mutated genes. The “Copy Number Alterations” panel shows select copy number alterations (high level amplifications and focal deletions) that are differentially present across the iClusters. The “Additional Features” panel highlights miscellaneous features that also distinguish the iClusters, including the presence of miR-200a/b alterations, UCEC-like cases, and BCAR4 fusion events. The color key for each feature is present to the right of the plots.
Extended Data Figure 9
Extended Data Figure 9. miR-200a/b associations with EMT-regulating genes and somatic alterations within RTK, PI3K, MAPK, and TGFβR2 pathways in cervical cancer
a, Expression levels for miR-200a and miR-200b compared to DNA methylation level at their promoter. Samples were called altered if the miRs were concurrently hypermethylated (β > 0.3) and downregulated (red cases). b, mRNA expression levels for ZEB2, a target of both miR-200a and miR-200b, in subsets of miR-200a/b altered samples. ZEB2 is upregulated in cases with concurrent hypermethylation and downregulation of the miRs. c, mRNA expression levels of both ZEB1 and ZEB2 in miR-200a/b hypermethylated/downregulated (Altered) and all other (WT) samples. d, Correlations of miR-200a and miR-200b expression with multiple genes involved in EMT signaling across squamous cell carcinomas and adenocarcinomas. e, Extent of genetic alterations and miR downregulation in the RTK, PI3K, MAPK, and TGFβ pathways across all cervical tumors.
Extended Data Figure 10
Extended Data Figure 10. Pathway biomarkers differentiating squamous cell carcinomas and adenocarcinomas
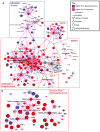
a, Cytoscape display of the largest interconnected regulatory network of PARADIGM pathway features differentially activated between squamous cell carcinomas and adenocarcinomas connected through hubs with ≥ 10 downstream targets. Hubs with ≥ 10 downstream targets are labeled. Genes showing mRNA-miRNA expression anti-correlation with strong evidence support are highlighted with thicker black outline and labeled. Top differentially expressed genes relating to immune function are also labeled. Node size is proportional to significance of differential activation. b, Zoom-in display of the p63 sub-network neighborhood. First neighbors (upstream or downstream) of four p63 complexes (bold text) are displayed in this view.
Extended Data Figure 11
Extended Data Figure 11. HPV integration and molecular characteristics in cervical cancer
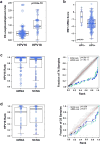
a, E6 unspliced/spliced ratio for HPV16 and HPV18 intragenic, enhancer, and intergenic sites. HPV16: median=0.44 (n=102), HPV18: median=0.93 (n=40). The p-value is from a two-sided Kolmogorov-Smirnov test. b, Distribution of RNAseq-based EMT score for HPV-negative (HPV-) and HPV-positive (HPV+) samples (n=178). c, Distributions of SCNA and mRNA abundance ranks (left panel) and distribution functions for SCNA and mRNA abundance ranks with 100 random expectation samples close to the diagonals (grey) (right panel) for genomic loci integrated with HPV16. d, Distributions described in c for genomic loci integrated with HPV18. BH-corrected p-values for the SCNA and mRNA abundance ranks (median p-values) are reported.
Figure 1
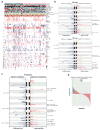
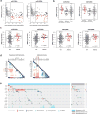
Figure 1. Somatic alterations in cervical cancer and associations with molecular platform features
CESC samples are ordered by histology and mutation rate (top panel), clinical and molecular platform features (second panel), significantly mutated genes (SMGs; third panel), and select somatic copy number alterations (SCNAs; fourth panel) are presented. SMGs are ordered by the overall mutation frequency and color-coded by mutation type. Novel SMGs identified in squamous cell carcinomas are labeled in turquoise text. The number of APOBEC signature mutations (red) and other mutations (blue) present in every SMG is plotted to the right of the SMG panel and the number of gene level SCNAs across all genes is plotted as gain (red) and loss (blue) to the right of the SCNA panel.
Figure 2
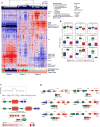
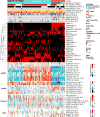
Figure 2. Multiplatform integrative clustering of cervical cancers
Integrative clustering of 178 Core Set cervical cancer cases using mRNA, methylation, miRNA, and copy number (CNV) data identifies two squamous carcinoma-enriched groups (Keratin-low and Keratin-high) and one adenocarcinoma-enriched group as shown in the feature bars. Features presented include histology, HPV clade, HPV integration status, UCEC-like status, APOBEC mutagenesis level, mRNA EMT score, tumor purity, and three SMGs that are significantly associated across the three iClusters (ERBB2 is presented for comparison purposes with its family member ERBB3). The cluster of cluster panel displays subtypes defined independently by mRNA, miRNA, methylation, reverse phase protein array (RPPA), CNV, and PARADIGM data. Black indicates that the sample is not represented in the cluster, red indicates that the sample is represented in the cluster, and gray represents data not available. The bottom heatmap panel shows select mRNAs, miRNAs, proteins, and CNVs that are either significantly associated with iCluster groups or identified as markers in other analyses. The heatmap color scale bar represents the scale for the features presented in the heatmap panel with a breakpoint of zero represented by white. APOBEC Mut., APOBEC Mutagenesis; inter., intermediate.
Figure 3
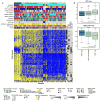
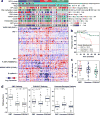
Figure 3. Proteomic landscape of cervical cancer
a, Clustered heatmap of samples (columns) and 192 antibodies (rows) for 155 samples (112 overlap with the Core Set of 178; see Extended Data Fig. 1a). Clusters presented from left to right include Hormone (dark blue), EMT (red), and PI3K/AKT (green). A subset of proteins differentially expressed between the clusters is highlighted. Clinical and molecular feature tracks are shown for those features which were significantly associated with RPPA clusters (p<0.05). Correlation between RPPA clusters and other categorical variables were detected by Chi-Squared test, while correlations with continuous variables were examined using the non-parametric Kruskal-Wallis test. In the heatmap blue color represents downregulated expression, red represents upregulated expression, and white represents no change in expression. NA represents data not available. b, Five-year Kaplan-Meier survival curves and log-rank test’s p-value comparing overall survival (OS) across all RPPA clusters using 115 Silhouette Width Core samples (Silhouette Core; see Supplemental Information S8). c, EMT mRNA score levels were calculated for all samples and compared across RPPA clusters. A significant p-value is presented for a one-way ANOVA analysis. d, Pathway scores for EMT, hormone receptor, and PI3K/AKT signaling pathways are presented for all RPPA clusters (x-axis), with significant pathway score differences between the clusters measured by Kruskal Wallis test.
Figure 4
Figure 4. Mutual exclusivity of somatic alterations within the PI3K/MAPK and TGFβR2 pathways
a, Multiple alterations affect receptor tyrosine kinase (RTK), AKT, and MAPK signaling in both squamous cell and adenocarcinoma cases. A schematic diagram of the pathways is shown for altered genes along with percentage of alteration in squamous cell and adenocarcinoma cases. Significant (p<0.05) Student’s t-test p-values for alteration frequency differences between squamous cell and adenocarcinomas are listed at the gene level, with genes marked with an asterisk (*). b, Distinct types of alterations (amplification, deletion, missense mutation, and truncating mutation) affect genes (rows) in these pathways in each sample (columns). c, TGFβ signaling is frequently altered in cervical tumors. Alterations in this pathway are divided between those likely impinging on TGFβ tumor suppressive functions and those affecting the TGFβ-driven EMT program. Legend also corresponds to layout in panel a. d, Samples with alterations targeting TGFβ tumor suppressive functions do not show significantly different EMT scores compared with all other samples (n.s = not significant); however, samples with low expression/high methylation of miR-200a/b have significantly higher EMT scores than all other samples. miR-down: met double-threshold of methylated and downregulated as described in Methods.
Figure 5
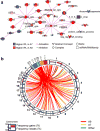
Figure 5. HPV integration and differential pathway activation between HPV subtypes
a, Cytoscape display of the largest interconnected regulatory network of PARADIGM integrated pathway level (IPL) features showing differential inferred activation between HPV A9 and A7 squamous carcinomas (n= 101 and n=35, respectively). Node color and intensity reflect the level of differential activation. Node size represents level of significance. Regulatory nodes with at least 5 downstream targets are highlighted in bold text. SFN is within a subnetwork identified by Functional Epigenetic Module (FEM) analysis (Supplemental Information S13) as disrupted between HPV A9 and A7 squamous cell carcinomas, and is highlighted using a bold black outline. b, Circos plot showing frequency (0–100%) of gains and losses for regions of each chromosome (outer circle). Lines within inner circle indicate integration breakpoints from the HPV genome to the human genome as defined in Methods, Supplemental Information S2, and Supplemental Table 3. Lines are color coded by HPV clade.

Comment in

Similar articles

  • Distinct pattern of TP53 mutations in human immunodeficiency virus-related head and neck squamous cell carcinoma.
    Gleber-Netto FO, Zhao M, Trivedi S, Wang J, Jasser S, McDowell C, Kadara H, Zhang J, Wang J, William WN Jr, Lee JJ, Nguyen ML, Pai SI, Walline HM, Shin DM, Ferris RL, Carey TE, Myers JN, Pickering CR; Head and Neck Cancer Specialized Program of Research Excellence (SPORE) Human Immunodeficiency Virus (HIV) Supplement Consortium. Gleber-Netto FO, et al. Cancer. 2018 Jan 1;124(1):84-94. doi: 10.1002/cncr.31063. Epub 2017 Oct 20. Cancer. 2018. PMID: 29053175 Free PMC article.
  • Landscape of genomic alterations in cervical carcinomas.
    Ojesina AI, Lichtenstein L, Freeman SS, Pedamallu CS, Imaz-Rosshandler I, Pugh TJ, Cherniack AD, Ambrogio L, Cibulskis K, Bertelsen B, Romero-Cordoba S, Treviño V, Vazquez-Santillan K, Guadarrama AS, Wright AA, Rosenberg MW, Duke F, Kaplan B, Wang R, Nickerson E, Walline HM, Lawrence MS, Stewart C, Carter SL, McKenna A, Rodriguez-Sanchez IP, Espinosa-Castilla M, Woie K, Bjorge L, Wik E, Halle MK, Hoivik EA, Krakstad C, Gabiño NB, Gómez-Macías GS, Valdez-Chapa LD, Garza-Rodríguez ML, Maytorena G, Vazquez J, Rodea C, Cravioto A, Cortes ML, Greulich H, Crum CP, Neuberg DS, Hidalgo-Miranda A, Escareno CR, Akslen LA, Carey TE, Vintermyr OK, Gabriel SB, Barrera-Saldaña HA, Melendez-Zajgla J, Getz G, Salvesen HB, Meyerson M. Ojesina AI, et al. Nature. 2014 Feb 20;506(7488):371-5. doi: 10.1038/nature12881. Epub 2013 Dec 25. Nature. 2014. PMID: 24390348 Free PMC article.
  • Somatic mutations in epidermal growth factor receptor signaling pathway genes in non-small cell lung cancers.
    Lee SY, Kim MJ, Jin G, Yoo SS, Park JY, Choi JE, Jeon HS, Cho S, Lee EB, Cha SI, Park TI, Kim CH, Jung TH, Park JY. Lee SY, et al. J Thorac Oncol. 2010 Nov;5(11):1734-40. doi: 10.1097/JTO.0b013e3181f0beca. J Thorac Oncol. 2010. PMID: 20881644
  • Small Cell and Other Rare Histologic Types of Cervical Cancer.
    Marchocki Z, Swift B, Covens A. Marchocki Z, et al. Curr Oncol Rep. 2022 Nov;24(11):1531-1539. doi: 10.1007/s11912-022-01316-x. Epub 2022 Aug 10. Curr Oncol Rep. 2022. PMID: 35947285 Review.
  • A short review on cervical cancer cell lines characterization and their corresponding human leukocyte antigen (HLA) type expression.
    Rajan RS, Dass SA, Tye GJ, Balakrishnan V. Rajan RS, et al. Eur Rev Med Pharmacol Sci. 2022 May;26(10):3570-3576. doi: 10.26355/eurrev_202205_28852. Eur Rev Med Pharmacol Sci. 2022. PMID: 35647838 Review.

Cited by

References

    1. Ferlay J, et al. Cancer incidence and mortality worldwide: Sources, methods and major patterns in GLOBOCAN 2012. Int J Cancer. 2015;136:E359–E386. - PubMed
    1. Schiffman M, et al. Human papillomavirus testing in the prevention of cervical cancer. J Natl Cancer Inst. 2011;103:368–383. - PMC - PubMed
    1. Uyar D, Rader J. Genomics of cervical cancer and the role of human papillomavirus pathobiology. Clin Chem. 2014;60:144–146. - PubMed
    1. Moody CA, Laimins LA. Human papillomavirus oncoproteins: pathways to transformation. Nat Rev Cancer. 2010;10:550–560. - PubMed
    1. The Cancer Genome Atlas Research Network. Comprehensive genomic characterization of squamous cell lung cancers. Nature. 2012;489:519–525. - PMC - PubMed

Publication types

MeSH terms

Substances