. 2017 Jan 23:8:14124.
doi: 10.1038/ncomms14124.

mTORC1 inhibition in cancer cells protects from glutaminolysis-mediated apoptosis during nutrient limitation

Affiliations

mTORC1 inhibition in cancer cells protects from glutaminolysis-mediated apoptosis during nutrient limitation

Victor H Villar et al. Nat Commun. .

Abstract

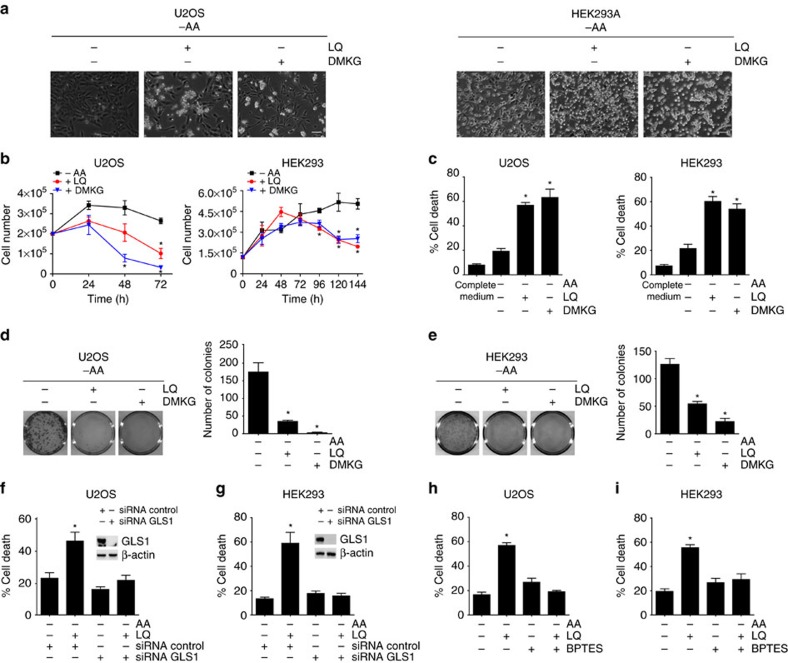
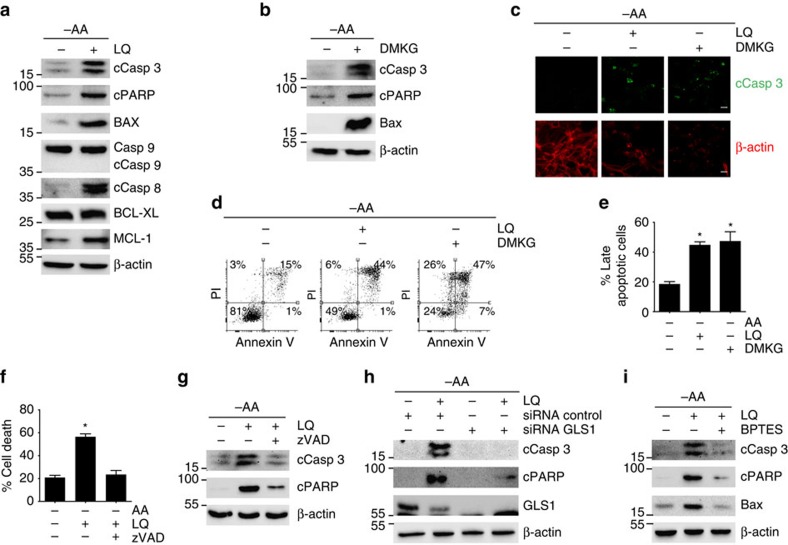
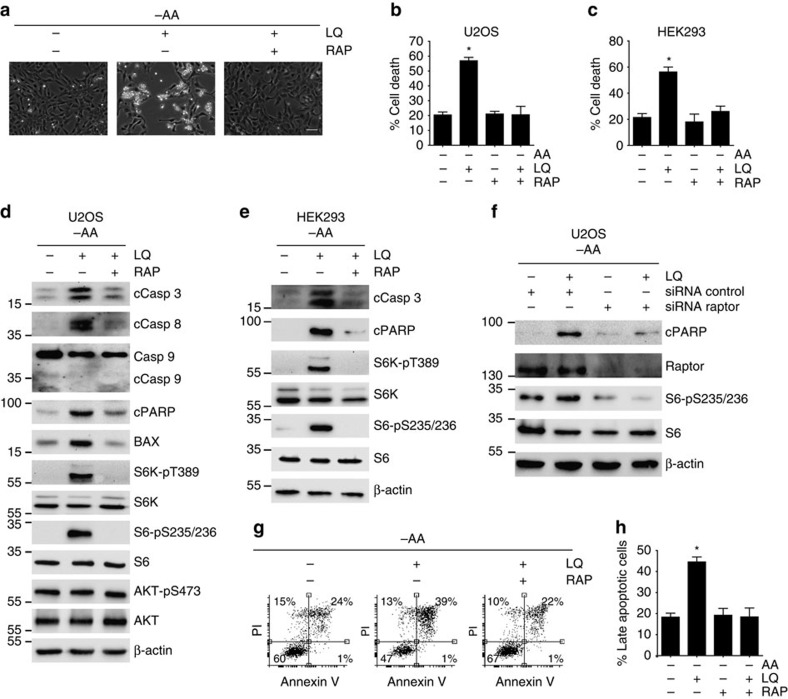
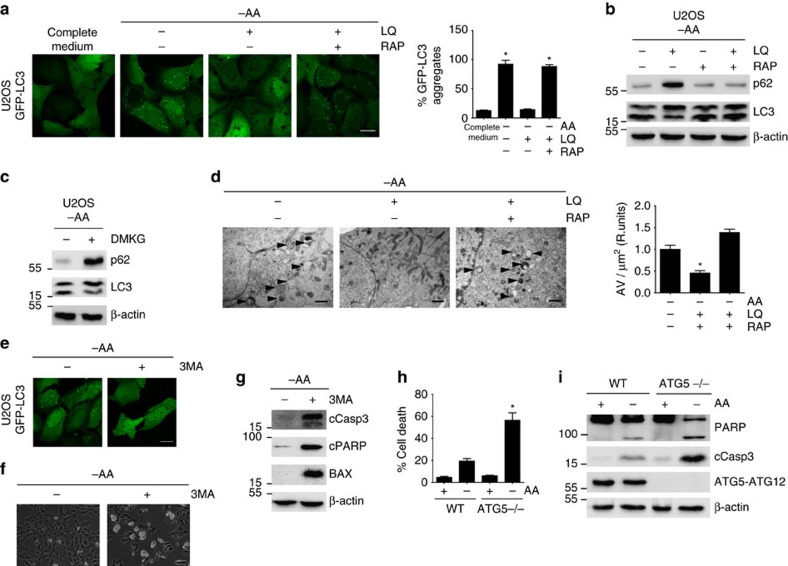
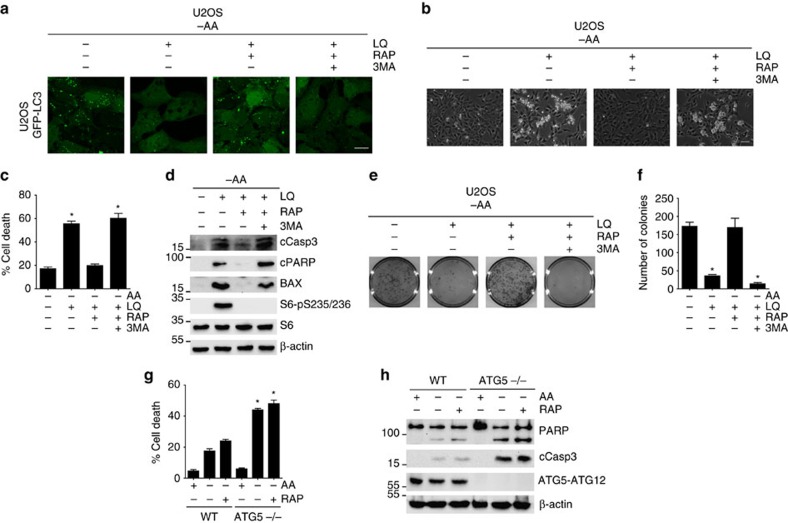
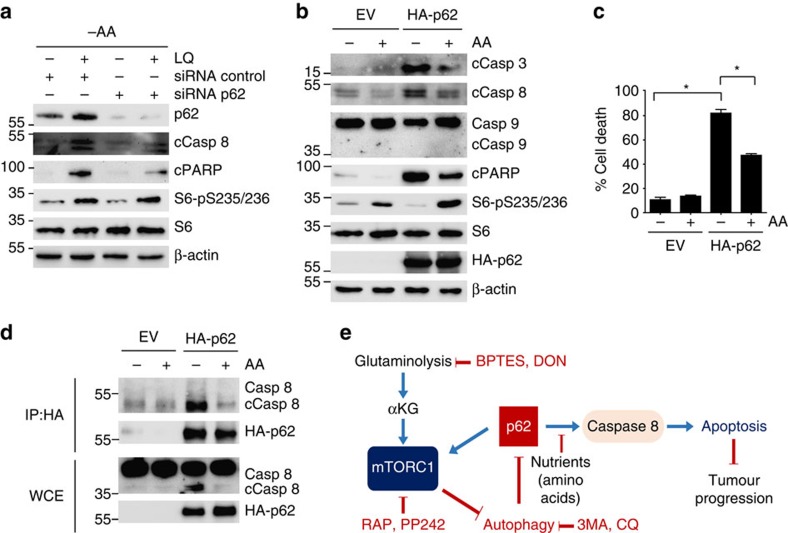
A master coordinator of cell growth, mTORC1 is activated by different metabolic inputs, particularly the metabolism of glutamine (glutaminolysis), to control a vast range of cellular processes, including autophagy. As a well-recognized tumour promoter, inhibitors of mTORC1 such as rapamycin have been approved as anti-cancer agents, but their overall outcome in patients is rather poor. Here we show that mTORC1 also presents tumour suppressor features in conditions of nutrient restrictions. Thus, the activation of mTORC1 by glutaminolysis during nutritional imbalance inhibits autophagy and induces apoptosis in cancer cells. Importantly, rapamycin treatment reactivates autophagy and prevents the mTORC1-mediated apoptosis. We also observe that the ability of mTORC1 to activate apoptosis is mediated by the adaptor protein p62. Thus, the mTORC1-mediated upregulation of p62 during nutrient imbalance induces the binding of p62 to caspase 8 and the subsequent activation of the caspase pathway. Our data highlight the role of autophagy as a survival mechanism upon rapamycin treatment.


Figures

Figure 1
Figure 1. Long-term glutaminolysis activation during amino acid restriction decreased cell viability.
(a) U2OS (left panel) and HEK923 (right panel) cells were starved for all the amino acids (−AA) in the presence or absence of LQ or DMKG (2 mM) for 72 h (U2OS) or 144 h (HEK293). Representative microscopy images of the cells are shown for the indicated conditions. The scale bar represents 100 μm. (b) Proliferation curves for U2OS and HEK293 were determined upon −AA, in the presence or the absence of LQ and DMKG after 24–144 h. (c) Percentage of cell death was estimated using trypan blue exclusion assay upon LQ or DMKG treatment after 72 h for U2OS or 144 h for HEK293, as indicated. (d,e) A representative image of a clonogenic assay (left panel) and the quantification of the colonies formed in three independent experiments (right panel) are shown for U2OS (d) and HEK293 (e). (f,g) Percentage of cell death was estimated in cells depleted of GLS1 (siRNA GLS1) upon amino acids starvation either in the presence or the absence of LQ after 72 h for U2OS (f) and 144 h for HEK293 (g). (h,i) Percentage of cell death was estimated upon amino acids starvation either in the presence or the absence of LQ and BPTES (30 μM) after 72 h for U2OS and 144 h for HEK293 cells. Graphs show mean values±s.e.m. (n=3). *P<0.05 (Anova post hoc Bonferroni).
Figure 2
Figure 2. Glutaminolysis activation during amino acid restriction induced apoptosis.
(a,b) U2OS cells were starved for amino acid either in the presence or the absence of LQ (a) or DMKG (2 mM) (b). The level of the pro-apoptotic proteins (caspase 3, PARP, BAX, Caspase 8 and caspase 9) and anti-apoptotic member of the Bcl-2 family (Bcl-XL and MCL-1) were determined by western blot for U2OS cells treated as indicated. The scale bar represents 20 μm. (c) Immunofluorescence analysis of cleaved caspase 3 and actin filaments are shown for LQ-treated and DMKG-treated cells upon amino acid starvation after 72 h in U2OS cells. (d) Flow cytometry analysis of annexin V/PI staining of U2OS cells treated with LQ or DMKG as indicated. (e) Quantification of late apoptosis (annexin V/PI-positive cells) for the indicated conditions in U2OS cells. (f,g) Effect of the inhibition of apoptosis using zVAD-FMK (1 μM) on the percentage of cell death (f) and apoptotic markers (g) in LQ-treated U2OS cells. (h,i) Western blot analysis of apoptotic markers upon GLS1 silencing using siRNA (h) or upon GLS inhibition using BPTES (i) in LQ-treated U2OS cells. Graphs show mean values±s.e.m. (n=3). *P<0.05 (Anova post hoc Bonferroni).
Figure 3
Figure 3. mTORC1 inhibition prevented the glutaminolysis induced apoptosis.
(a) Representative microscopy image of U2OS cells upon LQ treatment either in the presence or the absence of rapamycin after 72 h. The scale bar represents 100 μm. (b,c) Percentage of cell death as estimated using trypan blue exclusion assay is U2OS cells (b) or HEK293 cells (c) upon LQ treatment either in the presence or the absence of rapamycin for 72 h (U2OS) or 144 h (HEK293). (d,e) Western blot analysis of apoptotic markers and mTORC1 downstream targets upon rapamycin (RAP) addition in LQ-treated U2OS cells (d) and HEK293 cells (e). (f) Western blot analysis of apoptotic markers and mTORC1 downstream targets upon the silencing of Raptor using siRNA (thus inhibiting mTORC1 activity) in LQ-treated U2OS cells. (g) Flow cytometry analysis of annexin V/PI staining of U2OS cells treated with LQ and rapamycin as indicated. (h) Quantification of late apoptosis (annexin V/PI-positive cells) for the U2OS cells treated as in g, as indicated. Graphs show mean values±s.e.m. (n=3). *P<0.05 (Anova post hoc Bonferroni).
Figure 4
Figure 4. Glutaminolysis activated cells showed an mTORC1 dependent inhibition of autophagy during amino acid restriction.
(a) GFP-LC3 expressing U2OS cells were starved for amino acids in the presence or absence of LQ and RAP for 72 h as indicated. Autophagosome formation upon GFP-LC3 aggregation was determined (left panel) and quantified (right panel) using confocal microscopy. The scale bar represents 20 μm. (b,c) Western blot analysis of U2OS cells treated with LQ, DMKG and RAP as indicated to determine the levels of p62 and LC3II after 72 h. (d) Transmission electron microscopy (TEM) images of U2OS cells starved for amino acid in the presence or absence of LQ and RAP after 72 h. The number of autophagy-related vesicles per μm2 was quantified for each indicated condition. The scale bar represents 1 μm. (e) GFP-LC3 expressing U2OS cells were starved for amino acids in the presence or absence of 3MA (5 mM) during 72 h. Autophagosome formation upon GFP-LC3 aggregation was determined using confocal microscopy. The scale bar represents 20 μm. (f,g) Representative microscopy image (f) and western blot analysis of apoptotic markers (g) in U2OS cells upon 3MA treatment during 72 h as indicated. The scale bar represents 100 μm. (h,i) WT and ATG5−/− MEFs were incubated either in the presence (+AA) or the absence (−AA) of amino acids (+AA) for 24 h. Cell viability using trypan blue exclusion assay (h) and western blot analysis of apoptotic markers (i) are shown. Graphs show mean values±s.e.m. (n=3). *P<0.05 (Anova post hoc Bonferroni).
Figure 5
Figure 5. Autophagy was necessary for the ability of rapamycin treatment to prevent glutaminolysis and mTORC1 induced apoptosis.
(a) GFP-LC3 expressing U2OS cells were starved for amino acids in the presence or absence of LQ, RAP and 3MA for 72 h as indicated. Autophagosome formation upon GFP-LC3 aggregation was determined using confocal microscopy. The scale bar represents 20 μm. (b) U2OS cells were starved for all the amino acids in the presence or absence of LQ, RAP and 3MA for 72 h as indicated. A representative microscopy image of the cells for the indicated conditions is shown. The scale bar represents 100 μm. (c) Percentage of cell death as estimated using trypan blue exclusion assay in U2OS treated as in b. (d) Western blot analysis of apoptotic markers and mTORC1 downstream targets was assessed for U2OS cells treated as in b. (e,f) Clonogenic assay of U2OS cells treated as in b (e). The number of colonies in three independent experiments was quantified (f). (g,h) WT and ATG5−/− MEFs were incubated either in the presence (+AA) or the absence (−AA) of amino acids (+AA) and rapamycin as indicated for 24 h. Cell viability using trypan blue exclusion assay (g) and western blot analysis of apoptotic markers (h) are shown. Graphs show mean values±s.e.m. (n=3). *P<0.05 (Anova post hoc Bonferroni).
Figure 6
Figure 6. p62 interacts with and activates caspase 8 and apoptosis.
(a) U2OS cells were transfected either with a non-targeting siRNA (control) or siRNA against p62. Then cells were treated with LQ for 72 h. The activation of apoptotic markers and mTORC1 downstream targets were assessed by western blot analysis. (b,c) U2OS cells were transfected with HA-p62 for 24 h and then incubated in the presence or the absence of all the amino acids for 48 h as indicated. The expression of apoptotic markers and mTORC1 downstream targets were assessed by western blot (b), and cell viability was estimated using trypan blue exclusion assay (c). Graphs show mean values±s.e.m. (n=3). *P<0.05 (Anova post hoc Bonferroni). (d) U2OS cells were transfected with HA-p62 and the interaction of HA-p62 with endogenous caspase 8 was evaluated by immunoprecipitation upon amino acid starvation (−AA) or amino acid sufficiency (+AA). The co-precipitation of bot HA-p62 and caspase 8 was determined by western blot analysis. (e) Working model summarizing the results obtained in this work.

Similar articles

Cited by

References

    1. Bar-Peled L. & Sabatini D. M. Regulation of mTORC1 by amino acids. Trends Cell Biol. 24, 1–7 (2014). - PMC - PubMed
    1. Liko D. & Hall M. N. mTOR in health and in sickness. J. Mol. Med. (Berl) 93, 1061–1073 (2015). - PubMed
    1. Howell J. J., Ricoult S. J., Ben-Sahra I. & Manning B. D. A growing role for mTOR in promoting anabolic metabolism. Biochem. Soc. Trans. 41, 906–912 (2013). - PubMed
    1. Efeyan A. & Sabatini D. M. mTOR and cancer: many loops in one pathway. Curr. Opin. Cell Biol. 22, 169–176 (2010). - PMC - PubMed
    1. Sun S. Y. mTOR kinase inhibitors as potential cancer therapeutic drugs. Cancer Lett. 340, 1–8 (2013). - PMC - PubMed

Publication types