Systemic Immunity Is Required for Effective Cancer Immunotherapy
- PMID: 28111070
- PMCID: PMC5312823
- DOI: 10.1016/j.cell.2016.12.022
Systemic Immunity Is Required for Effective Cancer Immunotherapy
Abstract
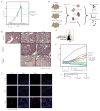
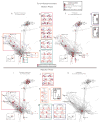
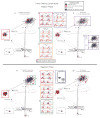
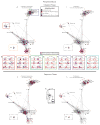
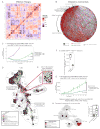
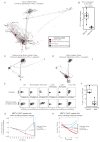
Immune responses involve coordination across cell types and tissues. However, studies in cancer immunotherapy have focused heavily on local immune responses in the tumor microenvironment. To investigate immune activity more broadly, we performed an organism-wide study in genetically engineered cancer models using mass cytometry. We analyzed immune responses in several tissues after immunotherapy by developing intuitive models for visualizing single-cell data with statistical inference. Immune activation was evident in the tumor and systemically shortly after effective therapy was administered. However, during tumor rejection, only peripheral immune cells sustained their proliferation. This systemic response was coordinated across tissues and required for tumor eradication in several immunotherapy models. An emergent population of peripheral CD4 T cells conferred protection against new tumors and was significantly expanded in patients responding to immunotherapy. These studies demonstrate the critical impact of systemic immune responses that drive tumor rejection.
Keywords: cancer immunotherapy; immune responses; immunotherapy; mass cytometry; secondary lymphoid organs; single-cell analysis; systems immunology; tumor immunology; tumor microenvironment.
Copyright © 2017 Elsevier Inc. All rights reserved.
Figures

Similar articles
-
A microparticle platform for STING-targeted immunotherapy enhances natural killer cell- and CD8+ T cell-mediated anti-tumor immunity.Biomaterials. 2019 Jun;205:94-105. doi: 10.1016/j.biomaterials.2019.03.011. Epub 2019 Mar 14. Biomaterials. 2019. PMID: 30909112 Free PMC article.
-
PD-L1 blockade engages tumor-infiltrating lymphocytes to co-express targetable activating and inhibitory receptors.J Immunother Cancer. 2019 Aug 14;7(1):217. doi: 10.1186/s40425-019-0700-3. J Immunother Cancer. 2019. PMID: 31412943 Free PMC article.
-
Testing Cancer Immunotherapy in a Human Immune System Mouse Model: Correlating Treatment Responses to Human Chimerism, Therapeutic Variables and Immune Cell Phenotypes.Front Immunol. 2021 Mar 29;12:607282. doi: 10.3389/fimmu.2021.607282. eCollection 2021. Front Immunol. 2021. PMID: 33854497 Free PMC article.
-
The path to reactivation of antitumor immunity and checkpoint immunotherapy.Cancer Immunol Res. 2014 Oct;2(10):926-36. doi: 10.1158/2326-6066.CIR-14-0153. Cancer Immunol Res. 2014. PMID: 25281320 Review.
-
The Obesity Paradox in Cancer, Tumor Immunology, and Immunotherapy: Potential Therapeutic Implications in Triple Negative Breast Cancer.Front Immunol. 2019 Aug 14;10:1940. doi: 10.3389/fimmu.2019.01940. eCollection 2019. Front Immunol. 2019. PMID: 31475003 Free PMC article. Review.
Cited by
-
Systemic immunity in cancer.Nat Rev Cancer. 2021 Jun;21(6):345-359. doi: 10.1038/s41568-021-00347-z. Epub 2021 Apr 9. Nat Rev Cancer. 2021. PMID: 33837297 Free PMC article. Review.
-
Dendritic Cell Tumor Vaccination via Fc Gamma Receptor Targeting: Lessons Learned from Pre-Clinical and Translational Studies.Vaccines (Basel). 2021 Apr 20;9(4):409. doi: 10.3390/vaccines9040409. Vaccines (Basel). 2021. PMID: 33924183 Free PMC article. Review.
-
Identification of immune subtypes and their prognosis and molecular implications in colorectal cancer.PLoS One. 2022 Nov 23;17(11):e0278114. doi: 10.1371/journal.pone.0278114. eCollection 2022. PLoS One. 2022. PMID: 36417424 Free PMC article.
-
The immune contexture and Immunoscore in cancer prognosis and therapeutic efficacy.Nat Rev Cancer. 2020 Nov;20(11):662-680. doi: 10.1038/s41568-020-0285-7. Epub 2020 Aug 4. Nat Rev Cancer. 2020. PMID: 32753728 Review.
-
Combination anti-CTLA-4 plus anti-PD-1 checkpoint blockade utilizes cellular mechanisms partially distinct from monotherapies.Proc Natl Acad Sci U S A. 2019 Nov 5;116(45):22699-22709. doi: 10.1073/pnas.1821218116. Epub 2019 Oct 21. Proc Natl Acad Sci U S A. 2019. PMID: 31636208 Free PMC article.
References
-
- Bandura DR, Baranov VI, Ornatsky OI, Antonov A, Kinach R, Lou X, Pavlov S, Vorobiev S, Dick JE, Tanner SD. Mass cytometry: technique for real time single cell multitarget immunoassay based on inductively coupled plasma time-of-flight mass spectrometry. Anal Chem. 2009;81:6813–6822. - PubMed
-
- Bates GJ, Fox SB, Han C, Leek RD, Garcia JF, Harris AL, Banham AH. Quantification of regulatory T cells enables the identification of high-risk breast cancer patients and those at risk of late relapse. J Clin Oncol. 2006;24:5373–5380. - PubMed
Publication types
MeSH terms
Substances
Grants and funding
- T32 CA009302/CA/NCI NIH HHS/United States
- R33 CA183654/CA/NCI NIH HHS/United States
- R01 AI118884/AI/NIAID NIH HHS/United States
- F31 CA189331/CA/NCI NIH HHS/United States
- U19 AI057229/AI/NIAID NIH HHS/United States
- DP5 OD023056/OD/NIH HHS/United States
- U19 AI100627/AI/NIAID NIH HHS/United States
- R01 HL120724/HL/NHLBI NIH HHS/United States
- HHSN272201200028C/AI/NIAID NIH HHS/United States
- U54 CA209971/CA/NCI NIH HHS/United States
- F32 CA189408/CA/NCI NIH HHS/United States
- R01 CA196657/CA/NCI NIH HHS/United States
LinkOut - more resources
Full Text Sources
Other Literature Sources
Molecular Biology Databases
Research Materials
Miscellaneous

