. 2017 Jan 19;13(1):e1006136.
doi: 10.1371/journal.ppat.1006136. eCollection 2017 Jan.

Static and Evolving Norovirus Genotypes: Implications for Epidemiology and Immunity

Affiliations

Static and Evolving Norovirus Genotypes: Implications for Epidemiology and Immunity

Gabriel I Parra et al. PLoS Pathog. .

Abstract

Noroviruses are major pathogens associated with acute gastroenteritis worldwide. Their RNA genomes are diverse, with two major genogroups (GI and GII) comprised of at least 28 genotypes associated with human disease. To elucidate mechanisms underlying norovirus diversity and evolution, we used a large-scale genomics approach to analyze human norovirus sequences. Comparison of over 2000 nearly full-length ORF2 sequences representing most of the known GI and GII genotypes infecting humans showed a limited number (≤5) of distinct intra-genotypic variants within each genotype, with the exception of GII.4. The non-GII.4 genotypes were comprised of one or more intra-genotypic variants, with each variant containing strains that differed by only a few residues over several decades (remaining "static") and that have co-circulated with no clear epidemiologic pattern. In contrast, the GII.4 genotype presented the largest number of variants (>10) that have evolved over time with a clear pattern of periodic variant replacement. To expand our understanding of these two patterns of diversification ("static" versus "evolving"), we analyzed using NGS the nearly full-length norovirus genome in healthy individuals infected with GII.4, GII.6 or GII.17 viruses in different outbreak settings. The GII.4 viruses accumulated mutations rapidly within and between hosts, while the GII.6 and GII.17 viruses remained relatively stable, consistent with their diversification patterns. Further analysis of genetic relationships and natural history patterns identified groupings of certain genotypes into larger related clusters designated here as "immunotypes". We propose that "immunotypes" and their evolutionary patterns influence the prevalence of a particular norovirus genotype in the human population.


Conflict of interest statement

The authors have declared that no competing interests exist.

Figures
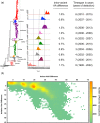
Fig 1
Fig 1. Diversity and evolutionary pattern of GII.4 noroviruses.
(a) Phylogenetic tree showing the presence of multiple variants within the GII.4 genotype. Each variant is identified by a different color and name. Sequences from each variant were collected from a period of 3–8 years (mean: 5.3 years) until replaced by a novel variant. Tree was constructed using nt sequences encoding the VP1 and Kimura 2-parameter and Neighbor-Joining method as implemented in MEGA v6. Plots indicate the number of sequences collected each year from ten major GII.4 variants. (b) Diversity plot showing the accumulation of aa mutations over time in the VP1 from GII.4 viruses. Note that a higher number of strains accumulate at ~5% aa difference (25/539) and 5 years of detection difference, which correlates with the timespan where a novel variant displaces the old one. Heat map represents the number of pairwise comparisons, red being the highest and green the lowest number of pairwise comparisons.
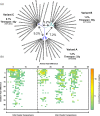
Fig 2
Fig 2. Diversity and evolutionary pattern of GII.6 viruses.
(a) Phylogenetic tree showing the presence of three variants (A-C) within the GII.6 genotype. Each variant branch is identified by different shades of blue. The timespan of isolation of the oldest and newest strain and the percent amino acid difference within each variant is shown. Arrows between branches represent the percent amino acid difference between variants. Tree was constructed using nt sequences encoding the VP1 and Kimura-2 parameter and Neighbor-Joining method as implemented in MEGA v6. (b) Diversity plot showing the presence of discrete values representing differences within and between the three GII.6 variants. The GII.6 genotype has strains that differ by only a few aa (<10) but identified over 40 years apart, or strains can differ by almost 57 aa and detected in the same year. Heat map represents the number of pairwise comparisons, red being the highest and green the lowest number of pairwise comparisons. Similar data were generated for 14 other norovirus genotypes.
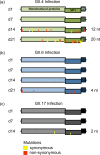
Fig 3
Fig 3. Intra-host diversity of noroviruses in an immunocompetent individual with three sequential norovirus infections.
Summary of NGS data from consecutive samples collected from an individual who shed (a) GII.4 (Sydney variant), (b) GII.6 (B variant), or (c) GII.17 (D variant) norovirus for 2–3 weeks (Days 1, 7, 14, and 21). All consensus sequences were identical to the reference (Day 1); however, mutations ranging from 5 to 50% of the total reads (indicated with yellow bars, synonymous, and red bars, non-synonymous) arose at later time points for each virus. GII.4 viruses are indicated in green, GII.6 in blue, and GII.17 in grey.
Fig 4
Fig 4. Inter-host diversity of noroviruses in immunocompetent individuals.
Summary of NGS data from multiple patient samples collected during discrete outbreaks. Genomes analyzed from the GII.6 outbreak were colored in blue (a), and those from the GII.4 outbreaks in green (b). All viral sequences were nearly identical (≤ 5 nt differences) within each outbreak; however, GII.4 viruses accumulated over 80 nt mutations within a single season (3 months). Red (non-synonymous) and yellow (synonymous) bars indicate substitutions compared with the consensus sequence of the outbreak strain. Note that despite the occurrence of over 80 nt mutations throughout the genome of GII.4 strains within a single season, all mutations that mapped into the VP1 were synonymous.
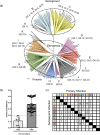
Fig 5
Fig 5. Clustering of human norovirus genotypes into “immunotypes”.
(a) Phylogenetic tree showing the presence of 7 clusters containing two or more genotypes and 5 comprised of a single genotype, which define the 12 larger order clusters designated as immunotypes (A-L) for this study. The phylogenetic tree was constructed using three representative strains from each variant described for each genotype except for GII.4, where only one strain from each of the variants was used. The evolutionary distances of the amino acid sequences were computed using the Poisson correction method and the tree inferred using the Neighbor-Joining method and bootstrap test (1000 replicates). (b) Amino acid (aa) differences within (intra-immunotype) and between (inter-immunotype) the proposed immunotypes. The bars indicate the average of the aa differences and standard error. The red dotted line indicates the cut-off value (≥20%) of aa differences between groups. (c) Matrix showing the frequency of re-infection and the genotypes detected. Data was obtained from studies that followed the natural history of norovirus infection [, , , , –54]. Each genotype is grouped within their respective immunotype. Re-infection with strains from the same immunotype are indicated by black cells. Note that the eight cases of re-infection within the immunotype G represent re-infections with different GII.4 variants.
Fig 6
Fig 6. Model of norovirus evolution and infection.
GII.4 noroviruses acquire phenotypic changes in their major capsid protein over time (evolving genotype), while non-GII.4 viruses retain a highly conserved capsid protein for decades (static genotype). Clustering of the different noroviruses has shown the presence of twelve groups (provisionally called immunotypes), with only one immunotype containing an evolving genotype (GII.4). Immunotypes represented by static genotypes can only re-infect individuals naïve to that particular immunotype, while the GII.4 evolving genotype can re-infect individuals by periodically replacing its variants. This model predicts that children are constantly exposed and infected with strains from each of the different immunotypes (until a broad immunity develops), while older individuals are more likely to become ill from evolving genotypes. This model would explain the epidemiological differences reported in the distribution of norovirus genotypes in children and adults [17, 21, 37, 38].

Similar articles

Cited by

References

    1. Sanjuan R, Nebot MR, Chirico N, Mansky LM, Belshaw R. Viral mutation rates. J Virol. 2010;84(19):9733–48. PubMed Central PMCID: PMC2937809. 10.1128/JVI.00694-10 - DOI - PMC - PubMed
    1. Drake JW. Rates of spontaneous mutation among RNA viruses. Proc Natl Acad Sci U S A. 1993;90(9):4171–5. PubMed Central PMCID: PMC46468. - PMC - PubMed
    1. Duffy S, Shackelton LA, Holmes EC. Rates of evolutionary change in viruses: patterns and determinants. Nat Rev Genet. 2008;9(4):267–76. 10.1038/nrg2323 - DOI - PubMed
    1. Worobey M, Holmes EC. Evolutionary aspects of recombination in RNA viruses. J Gen Virol. 1999;80 (Pt 10):2535–43. - PubMed
    1. Grenfell BT, Pybus OG, Gog JR, Wood JL, Daly JM, Mumford JA, et al. Unifying the epidemiological and evolutionary dynamics of pathogens. Science. 2004;303(5656):327–32. 10.1126/science.1090727 - DOI - PubMed

Publication types

Grants and funding

This work was funded by the Division of Intramural Research, National Institute of Allergy and Infectious Diseases, NIH, DHHS. The funders had no role in study design, data collection and analysis, decision to publish, or preparation of the manuscript.