. 2017 Jan 26;541(7638):481-487.
doi: 10.1038/nature21029. Epub 2017 Jan 18.

Neurotoxic reactive astrocytes are induced by activated microglia

Affiliations

Neurotoxic reactive astrocytes are induced by activated microglia

Shane A Liddelow et al. Nature. .

Abstract

Reactive astrocytes are strongly induced by central nervous system (CNS) injury and disease, but their role is poorly understood. Here we show that a subtype of reactive astrocytes, which we termed A1, is induced by classically activated neuroinflammatory microglia. We show that activated microglia induce A1 astrocytes by secreting Il-1α, TNF and C1q, and that these cytokines together are necessary and sufficient to induce A1 astrocytes. A1 astrocytes lose the ability to promote neuronal survival, outgrowth, synaptogenesis and phagocytosis, and induce the death of neurons and oligodendrocytes. Death of axotomized CNS neurons in vivo is prevented when the formation of A1 astrocytes is blocked. Finally, we show that A1 astrocytes are abundant in various human neurodegenerative diseases including Alzheimer's, Huntington's and Parkinson's disease, amyotrophic lateral sclerosis and multiple sclerosis. Taken together these findings help to explain why CNS neurons die after axotomy, strongly suggest that A1 astrocytes contribute to the death of neurons and oligodendrocytes in neurodegenerative disorders, and provide opportunities for the development of new treatments for these diseases.


Figures

EXTENDED DATA FIGURE 1
EXTENDED DATA FIGURE 1. Csf1r−/− mice lack microglia and have no compensatory increase in brain myeloid cell populations after LPS or vehicle control injections
a–c, gating strategy (live, single cells) for subsequent analysis of surface protein immunostainng. d,e, gating strategy for TMEM119+ (microglia) and CD45L°CD11b+ cells used for further analysis. f–h, representative plots showing abundant macrophage populations in P8 WT mice: CD45L° TMEM119+/TMEM119-, and CD45HI brain macrophages (f), CD11B+/CD45L° and CD11B+/CD45HI cells after saline (g) and LPS (h) injection. i, representative plots showing near-complete absence of brain macrophages in Csf1r−/− mice: CD45L° TMEM119-/TMEM119-, and CD45HI brain macrophages (i), CD11B+/CD45L° and CD11B+/CD45HI cells after saline (j) and LPS (k) injection. l, relative abundance of CD11B+/CD45L° macrophages after LPS or control injection in WT compared to Csf1r−/− mice, expressed as percent of total gated events shown in a. m, relative abundance of CD11B+/CD45HI cells after LPS treatment, normalized to saline control injection in WT and Csf1r−/− animals. N = 3 individual animals per treatment condition and genotype, error bars expressed as s.e.m. * p < 0.05, one-way ANOVA (l); p = 0.77, Student’s T-test (m), compared to age-matched wild type control.
EXTENDED DATA FIGURE 2
EXTENDED DATA FIGURE 2. Pexinartinib (PLX-3397)- treated adult mice have dramatic reduction in number of microglia and no increase in myeloid cell infiltration after LPS compared to vehicle control treatment
a–c, representative plots showing abundant macrophage populations in P28 WT control mice: TMEM119+ microglia (a), CD11B+/CD45L° and CD11B+/CD45HI cells after saline (b) and LPS (right plot) injection. d–f, representative plots showing large reduction in macrophage populations after PLX-3397 treatment: TMEM119- microglia (d), CD11B+/CD45L° and CD11B+/CD45HI cells after saline (e) and LPS (f) injection. g,h, gating strategy for TMEM119+ (microglia) and CD45L°CD11b+ cells used for analysis. i, relative abundance of CD11B+/CD45L° macrophages in WT compared to PLX-3397 mice, expressed as percent of total gated events. j, relative abundance of CD11B+/CD45HI cells after LPS treatment, normalized to saline control injection in WT and PLX-3397 treated animals. k, l, Fold change data from microfluidic qPCR analysis of WT and PLX-3397-treated mouse immunopanned astrocytes collected 24 hours following i.p. injection with saline or lipopolysaccharide (LPS, 5mg/kg). N = 3–6 individual animals per treatment condition and genotype, error bars expressed as SEM. * p < 0.05, one-way ANOVA (i); p = 0.90, Student’s T-test (j), compared to age-matched wild type control.
EXTENDED DATA FIGURE 3
EXTENDED DATA FIGURE 3. Screen for A1 reactive mediators
a, Immunopanning schema for purification of astrocytes. These astrocytes retain their non-activated in vivo gene profiles. b, Purified cells were 99+% pure with very little contamination from other central nervous system cells, as measured by qPCR for cell-type specific transcripts. c, Heat map of PAN reactive and A1- and A2-specific reactive transcript induction following treatment with a wide range of possible reactivity inducers. N = 8 per experiment. * p < 0.05, one-way ANOVA (increase compared to non-reactive astrocytes).
EXTENDED DATA FIGURE 4
EXTENDED DATA FIGURE 4. Screen for A1 reactive mediators
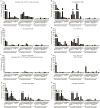
Fold change data from published microarray datasets of A1 (neuroinflammatory) reactive astrocytes (panel a), and microfluidic qPCR analysis of purified astrocytes treated with lipopolysaccharide (LPS)-activated microglia conditioned media (panel b), non-activated microglia conditioned media (panel c), Il-1α, TNFα and C1q (panel d), LPS-activated microglia conditioned media pre-treated with neutralizing antibodies to Il-1α, TNFα and C1q (panel e), astrocytes treated with Il-1α, TNFα and C1q and post-treated with FGF (panel f), microglia conditioned media activated with interferon gamma (IFNγ, panel g), and with TNFα (panel h). N = 6 per experiment. Error bars indicate s.e.m.
EXTENDED DATA FIGURE 5
EXTENDED DATA FIGURE 5. A1 astrocytes are morphologically simple
a, in vivo immunoflourescent staining for the water channel AQP4 and GFAP. Saline injected (control) mice had robust AQP4 protein localization to astrocytic endfeet on blood vessels (red stain, white arrows), while LPS injected mice had loss of polarization of AQP4 immunoreactivity, with bleeding of immunoreactivity away from endfeet (white arrows) and increased staining in other regions of the astrocyte (yellow arrowheads). Triple knock-out mice (Il1α−/−TNFα−/−C1q−/−) did retained AQP4 immunoreactivity in endfeet following LPS-induced neuroinflammation (white arrows), though some low-level ectopic immunoreactivty was still seen (yellow arrowheads). b–e, Quantification of cell morphology of GFAP-stained cultured astrocytes in resting or A1 reactive state: cross-sectional area (b), number of primary processes extending from cell soma (c), number of terminal branchlets (d), ratio of terminal to primary processes (complexity score, e). f, g, time-lapse tracing of control (f) and A1 reactive (g) astrocytes. Quantification shown in panel (h). A1 reactive astrocytes migrated approximately 75% less than control astrocytes over a 24 h period. * p < 0.05, one-way ANOVA. Error bars indicate s.e.m.
EXTENDED DATA FIGURE 6
EXTENDED DATA FIGURE 6. A1 reactive astrocytes do not promote synapse formation or neurite outgrowth
a, Representative images of retinal ganglion cells (RGCs) grown without astrocytes, or with control or A1 reactive astrocytes, stained with pre- and post-synaptic markers HOMER (green) and BASSOON (yellow). Colocalization of these markers (yellow puncta) was counted as a structural synapse. b, Total number of synapses normalized per each individual RGC. The number of synapses decreased after growth of RGCs with LPS-activated microglial conditioned media (MCM)-activated A1 reactive astrocyte conditioned media (ACM), or Il-1α, TNFα, C1q-activated A1 reactive astrocytes was not different. N = 50 neurons in each treatment. c, Quantification of individual pre- and post-synaptic puncta. d, Total length of neurite growth from RGCs. e, Density of RGC processes in cultures used in measurement of synapse number. There was no difference in neurite density close to RGC cell bodies (where synapse number measurements were made). f, Western blot analysis of proteoglycans secreted by control and A1 reactive astrocytes. Conditioned media from control astrocytes contained less chondroitin sulphate proteoglycans Brevican, Ng2, Neurocan and Versican, while simultaneously having higher levels of heparan sulphate proteoglycans Syndecan and Glypican. * p < 0.05, one-way ANOVA, except d (Student’s t-test). Scale bar: 10 μm. Error bars indicate s.e.m.
EXTENDED DATA FIGURE 7
EXTENDED DATA FIGURE 7. P4 lateral geniculate nucleus astrocytes become A1 reactive following systemic LPS injection
Fold change data from microfluidic qPCR analysis of astrocytes purified from dorsal lateral geniculate nucleus, 24 h after systemic injection with lipopolysaccharide (5mg/kg). N = 2.
EXTENDED DATA FIGURE 8
EXTENDED DATA FIGURE 8. Astrocyte-derived toxic factor promoting cell death
a, Quantification of dose-responsive cell death in retinal ganglion cells (RGCs) treated with astrocyte conditioned media from cells treated with Il-1α, TNFα, or C1q alone, or combination of all three (A1 astrocyte conditioned media, ACM) for 24 h. b, Death of RGCs was not due to a loss of trophic support, as treatment with 50% Control ACM did not decrease viability. Similarly, treatment with a 50/50 mix of Control and A1 ACM did not increase viability compared to A1 ACM only treated cells. c, A1-ACM-induced RGC toxicity could be removed by heat inactivation, or protease treatment. d–k, Cell viability of purified central nervous system cells treated with A1 ACM for 24 h: RGCs (d), hippocampal neurons (e), embryonic spinal motor neurons (f), oligodendrocyte precursor cells (OPCs, g), astrocytes (h), microglia/macrophages (i), endothelial cells (j), and pericytes (k). N = 4 for each experiment. l, Representative phase image showing death of purified embryonic spinal motor neurons in culture over 18 h (ethidium homodimer stain in red shows DNA in dead cells). m, qPCR for motor neuronal subtype-specific transcripts after 120h treatment with A1 ACM (50μg/ml). There was no decrease in levels of transcript for Nr2f2 (pre-ganglionic specific) and Wnt7a and Esrrg (γ specific), suggesting these motor neuron subtypes are immune to A1-induced toxicity. n, representative images with terminal deoxynucleotidyl transferase (TdT) dUTP nick-end labeling (TUNEL) staining in the dentate gyrus for wild type and Il1α−/−, TNFα−/−, or C1q−/− individual knockout animals following systemic LPS injection. Individual knock-out animals had far less TUNEL+ cells in the dentate gyrus (no cells in Il1α−/− or TNFα−/− animals) than wild type animals, suggesting A1-induced toxicity may be apoptosis. p–r, Percentage growth rate of gram negative bacterial cultures treated with A1 ACM for 16 h: B. thaliandensis (p), S. typhimurium (q), S. flexneri (r). N = 3. * p < 0.05, one-way ANOVA. Error bars indicate s.e.m.
EXTENDED DATA FIGURE 9
EXTENDED DATA FIGURE 9. Pharmacological blockade of astrocyte-derived toxic factor promoting cell death
Specific caspase inhibitory agents tested to block retinal ganglion cell (RGC) cell death: a, caspase-1. b, caspase-4. c, caspase-6. d, caspase-8. e, caspase-9. f, caspase-10. g, caspase-13. Only caspase-4 and caspase-13 inhibition was able to minimize RGC toxicity to A1 ACM (in addition to caspase-2 and -3, see Fig. 4 in main text). There was no cleaved caspase-4 or -13 detected in these cells. h, Necrostatin did not preserve RGC viability when cells were treated with A1 astrocyte conditioned media (ACM). i, j, k, l, glutamate excitotoxicity was checked by blocking AMPA receptors with antagonist NBQX (h), or NMDA antagonist D-AP5 (i), or kainite receptors with antagonist UBP-296 (GluR5 selective, j) and UBP-302 (k) – all of which were ineffective. * p < 0.05, one-way ANOVA. N = 4 in each. Error bars indicate s.e.m.
EXTENDED DATA FIGURE 10
EXTENDED DATA FIGURE 10. A1 reactive astrocytes inhibit oligodendrocyte precursor cell proliferation, differentiation and migration
a, Number of cells counted from phase-contrasted images of oligodendrocyte precursor cells (OPCs) treated with control and A1 reactive conditioned media (ACM). b, EdU ClickIt® assay determined growth of OPCs treated with increasing concentration of control and A1 ACM for 7 days. Both a and b show A1 ACM decreases OPC proliferation compared to control. c, d, Representative images of tracked OPC migration following treatment with control (c) and A1 (d) ACM, quantified in e. N = 100 cells from 10 separate experiments. f–h, Representative RT-PCR ethidium bromide gel showing no increase in mature OL marker Mbp transcript in OPCs treated with A1 ACM, with no change in OPC marker Pdgfra and Cspg4 expression – evidence of a lack of differentiation into mature oligodendrocytes. Treatment of OPCs with control ACM did not delay their differentiation into mature oligodendrocytes. N = 2. i–k, Total number of terminal process of oligodendrocyte lineage cells were counted as a measure of differentiation. Over 90% of cells differentiated by 24 h after removal of PDGFα when treated with control ACM (i). In contrast, treatment with a single dose (j) or daily doses (k) of A1 ACM delayed this level of differentiation by 72 h following a single dose, or indefinitely with chronic treatment. N = 6 separate experiments. l, representative phase images and time scale for oligodendrocyte differentiation assay (treated with control ACM). Scale bar: 100 μm (c,d), 25 μm (l). * p < 0.05, one-way ANOVA, except panel e (Student’s t-test). Error bars indicate s.e.m.
EXTENDED DATA FIGURE 11
EXTENDED DATA FIGURE 11. Activation of microglia following lipopolysaccharide injection in knockout mice
Mice from single global knock-outs of Il-1α (a), TNFα (b), and C1q (c) were treated with lipopolysaccharide (5 mg/kg, i.p.) and microglia collected 24 h later. Single knock-out animals still showed upregulation of many markers of microglial activation, as determined by qPCR. N = 3 for Il-1α and C1q, N = 5 for TNFα. d, quantitative PCR for microglia-derived A1-inducing molecules in the optic nerve of mice that received an optic nerve crush. Following crush, optic nerve contained neuroinflammatory microglia, while injection of A1 astrocyte-neutralizing antibodies into the vitreous of the eye did not decrease microglial activation (however it did halt A1 astrocyte activation in the retina – see Fig. 4). Error bars indicate s.e.m. * p < 0.05, one-way ANOVA.
EXTENDED DATA FIG 12
EXTENDED DATA FIG 12. Single cell analysis of C3 expression following neuroinflammatory and ischemic injury
a, cassettes of PAN-, A1-, and A2-specific gene transcripts used to determine polarization state of astrocyte reactivity. Upregulation of combinations of each of these cassettes of genes produces different 8 possible gene profiles for astrocytes following injury. b, 24 hours following LPS-induced systemic neuroinflammation, astrocytes were either non-reactive (no reactive genes upregulated), or fell into three forms of reactivity – all with A1 reactive cassette genes upregulated. Numbers in parenthesis state what percentage of individual cells for each subtype express C3. c, 24 hours following middle cerebral artery occlusion, both neuroinflammatory (A1 and A1-like) and ischemic (A2 and A2-like) reactive cells were detected. No cells expressing A2 cassette transcripts were C3 positive – validating C3 as an appropriate marker for visualizing A1 reactive astrocytes in disease. Segments of piecharts represent relative amounts of each subtype of astrocyte (control or reactive).
EXTENDED DATA FIG 13
EXTENDED DATA FIG 13. Additional markers for reactive astrocytes in human multiple sclerosis post mortem tissue samples
a, (same data as Fig. 5o–v – provided again here for comparison) Immunofluorescent staining showing C3 co-localized with GFAP in cell bodies of reactive astrocytes in acute MS lesions (red arrows). Note presence of A1-specific GFAP+ reactive astrocytes (C3+, CFB+, MX1+; red arrows) in close proximity to CD68+ phagocytes (activated microglia, macrophages; yellow arrowheads); A1-specific astrocytes are predominantly seen in high CD68+ density areas. C3-GFAP+ astrocyte (white arrow). Single channels and higher magnification are of selected area in a. Number of C3+GFAP+ colabelled cells is quantified and was highest in acute active demyelinating lesions, however they were still present in chronic active and inactive lesions. There was also a matching increase in C3 transcript in brains of patients with acute active demyelinating lesions compared to age-matched controls. Additional markers of A1 reactive astrocytes include complement factor B (CFB, b), and myxovirus (influenza virus) resistance gene MX dynamin Like GTPase 1 (MX1, c). Both CFB and MX1 co-localised 100% with C3, and were found in close association with CD68+ reactive microglia (yellow arrowheads). d, a single marker was found for A2 (ischemic) reactive astrocytes – S100 calcium-binding protein A10 (S100A10). S100A10 positive, GFAP colabelled astrocytes (red arrows) were only faintly labelled, and total numbers were very low. Note presence of A2-specific GFAP+ reactive astrocytes (S100A10; red arrows) in low CD68+ density areas (phagocytes; yellow arrowheads). The expression levels of S100a10, determined by qPCR, was not significantly altered at different stages of MS. N=3–8 disease and 5–8 control in each instance. Quantification was carried out on 5 fields of view and approximately 50 cells were surveyed per sample. Scale bar: 100 μm (a, b, c, d), 20 μm (enlarged inserts). Error bars indicate s.e.m. * p < 0.05, one-way ANOVA, compared to age-matched control. Abbreviations: FC, fold change; WM, white matter.
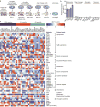
Figure 1
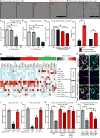
Figure 1. Serum-free culture model for A1 reactive astrocytes
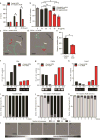
a, Heat map of reactive transcripts. Csf1r−/− mice (which lack microglia) fail to produce A1 astrocytes following LPS injection. LPS-activated microglia, or a combination of Il-1α, TNFα, and C1q are able to induce A1s in culture. b, Cytokine array analysis of LPS-activated microglia conditioned media (MCM) with increases in Il-1α, Il-1β and TNFα (Il-1β was not A1-specific). c, Western blot analysis of LPS-activated MCM for C1q protein. d, TGFβ was able to reset A1 reactive astrocytes to a non-reactive state. e, Individual knock-out (Il-1α−/−, TNFα−/−, C1q−/−), double (Il-1α−/−TNFα−/−), and triple knock-out (Il-1α−/−TNFα−/−C1q−/−) mice fail to produce A1s following LPS injection. Mice treated with Pexidartinib (PLX-3397) for 7 days to deplete 95% of microglia (Extended Data Fig. 1) still respond to LPS by producing A1s. f, Representative phase and fluorescent immunohistochemistry micrographs for GFAP and AQP4 of control and A1 reactive astrocytes. g, Western blot analysis of GFAP protein in cultured astrocytes showing approximate 3-fold increase in A1s compared to control. h, Measurements of cross-sectional area of astrocytes stained with GFAP. n = 6–8 for each experiment. * p < 0.05, one-way ANOVA. Error bars indicate s.e.m. Scale bar: 50 μm.
Figure 2
Figure 2. A1 reactive astrocytes do not promote synapse formation or function
a, Representative images of retinal ganglion cells (RGCs) grown without astrocytes, or with control or A1 reactive astrocytes, immunostained with pre- and post-synaptic markers HOMER (green) and BASSOON (red). Co-localization (yellow puncta) was counted as a structural synapse. b, Total number of synapses normalized per each individual RGC, n = 50 neurons in each treatment. c, Quantitative PCR for astrocyte secreted synaptogenic factors. d, Representative traces of whole-cell patch clamp mEPSC recordings from RGCs. e, Frequency of mEPSCs was significantly decreased in presence of A1s (RGCs without astrocytes: 0.19 ± 0.05 Hz n = 12 neurons, RGCs with resting astrocytes: 2.28 ± 0.51 Hz n = 14 neurons, RGCs with A1s: 0.95 ± 0.19Hz n = 16 neurons). f, A1s significantly decreased mean amplitude of mEPSCs (RGCs without astrocytes: 21.81 ± 0.78 pA n = 12 neurons, RGCs with resting astrocytes: 23.89 ± 0.38 pA n = 14 neurons, RGCs with A1s: 22.32 ± 0.37 pA n = 16 neurons). g, RGCs cultured with A1s had significantly more small amplitude mEPSCs in cumulative probability histograms (p < 0.0001 Kolmogorov-Smirnov test, n = 12–16 neurons per condition). * p < 0.05, one-way ANOVA. Error bars indicate s.e.m. Scale bar: 10 μm.
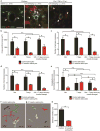
Figure 3
Figure 3. A1 astrocytes lose phagocytic capacity
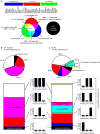
a, Phase and fluorescent images of cultured astrocytes engulfing pHrodo-conjugated synaptosomes (quantification in b) and myelin debris (quantification in c). d, Representative confocal reconstruction showing cholera toxin B, CTB-labelled retinal ganglion cell projections engulfed by control and A1 astrocytes in dorsal lateral geniculate nucleus. Quantification in e, n = 4 per group. f, Quantitative PCR analysis of astrocyte-specific phagocytic receptors (Megf10 and Mertk, decreased in A1 reactive astrocytes) and bridging molecules (Gas6 and Axl, unchanged). * p < 0.05, one-way ANOVA, or Student’s t-test as appropriate. Error bars indicate s.e.m. Scale bar: 15 μm (a); 10 μm (f).
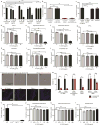
Figure 4
Figure 4. Astrocyte-derived toxic factor promoting cell death
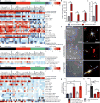
Representative phase image showing death of purified retinal ganglion cells (RGCs) in culture (ethidium homodimer stain in red shows DNA in dead cells (a, 24 h quantification in c), and differentiated oligodendrocytes (b, 24 h quantification in d). e, Quantification of A1-induced cell death in human dopaminergic neurons (5 days). f, Western blot analysis for cleaved caspase-2 and -3 in RGCs treated with control and A1 ACM. g, retro-orbital optic nerve crushes (ONC) produced A1s in the retina. Intravitreal injection of neutralizing antibodies to Il-1α, TNFα, and C1q blocked A1 production. h, RBPMS (RNA-binding protein with multiple splicing, an RGC marker) immunostaining of whole-mount retinas showed decreased number of RGCs in ONC, rescued with neutralizing antibody treatment. Quantification is shown post ONC at 7 days (i), 14 days (j) using neutralizing antibodies, and at 7 days using Il1α−/−TNFα−/− and Il1α−/−TNFα−/− C1q−/− animals (k), and microglia-depleted (PLX-3397-treated) animals (l). * p < 0.05, one-way ANOVA. n = 8 in each instance. Error bars indicate s.e.m. Scale bar: 100 μm (a,b); 20 μm (k).
Figure 5
Figure 5. A1 (C3 positive) reactive astrocytes in human disease
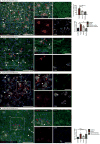
Representative in situ hybridization for C3 and immunofluorescent staining for S100β in Huntington’s (HD, a) and Alzheimer’s (AD, b) diseases, and amyotrophic lateral sclerosis (ALS, c), and co-immunofluorescent staining for C3 and GFAP in Parkinson’s disease (PD, d) and multiple sclerosis (MS, e). Quantification in HD (f), AD in both hippocampus (g) and prefrontal cortex (h), ALS (i), PD (j) and MS (k) shows around 30–60% of astrocytes in brain regions specific to each disease in humans are C3 positive A1s. l–p, Increase in expression of C3 transcript in all diseases (by qPCR). N=3–8 disease and 5–8 control in each instance. Quantification was carried out on 5 fields of view and approximately 50 cells were surveyed per sample. Scale bar: 100 μm (n,o), 20 μm (d,p–t), 10 μm (a–c). Error bars indicate s.e.m. * p < 0.05, Student’s T-test (f–j, l–o), one-way ANOVA (k,p) compared to age-matched control.

Comment in

Similar articles

Cited by

References

    1. Sofroniew MV, Vinters HV. Astrocytes: biology and pathology. Acta Neuropathol. 2010;119:7–35. - PMC - PubMed
    1. Clarke LE, Barres BA. Emerging roles of astrocytes in neural circuit development. Nat Rev Neurosci. 2013;14:311–21. - PMC - PubMed
    1. Chung WSS, et al. Astrocytes mediate synapse elimination through MEGF10 and MERTK pathways. Nature. 2013;504:394–400. - PMC - PubMed
    1. Liddelow S, Barres B. SnapShot: Astrocytes in Health and Disease. Cell. 2015;162:1170–1170 e1. - PubMed
    1. Zamanian JL, et al. Genomic analysis of reactive astrogliosis. J Neurosci. 2012;32:6391–410. - PMC - PubMed

Publication types

MeSH terms