. 2017 Feb 14;8(7):11600-11613.
doi: 10.18632/oncotarget.14591.

Multi-level suppression of receptor-PI3K-mTORC1 by fatty acid synthase inhibitors is crucial for their efficacy against ovarian cancer cells

Affiliations

Multi-level suppression of receptor-PI3K-mTORC1 by fatty acid synthase inhibitors is crucial for their efficacy against ovarian cancer cells

Renate Wagner et al. Oncotarget. .

Abstract

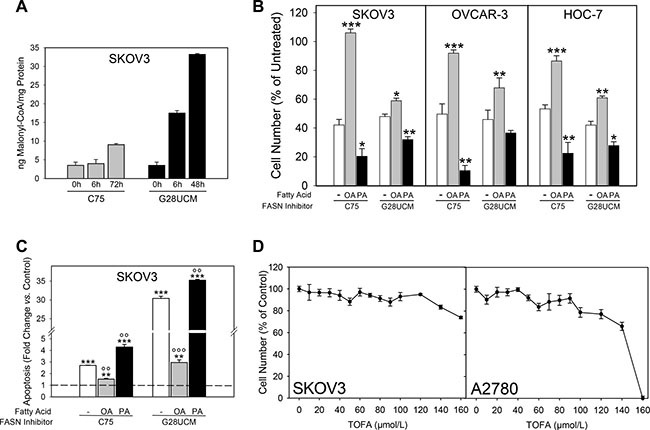
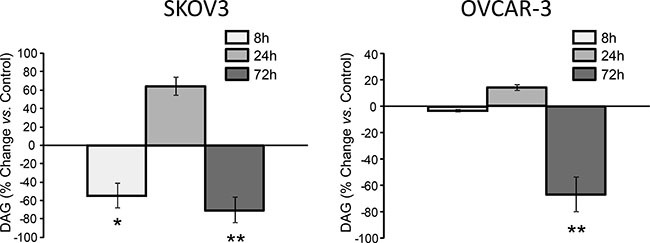
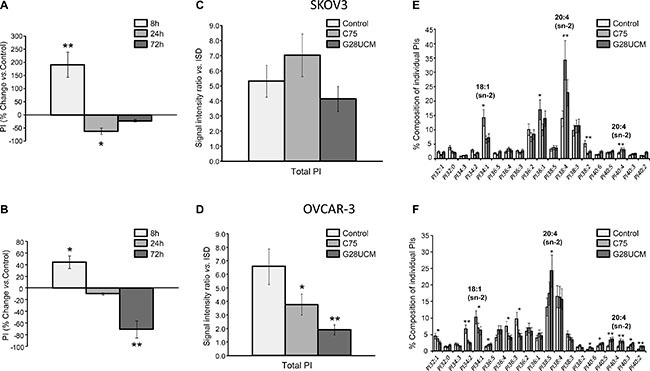
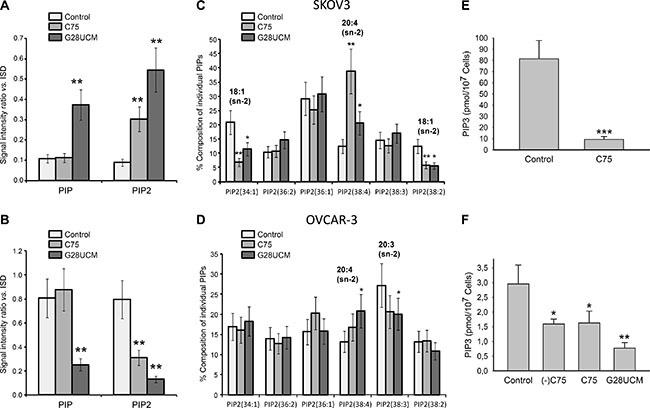
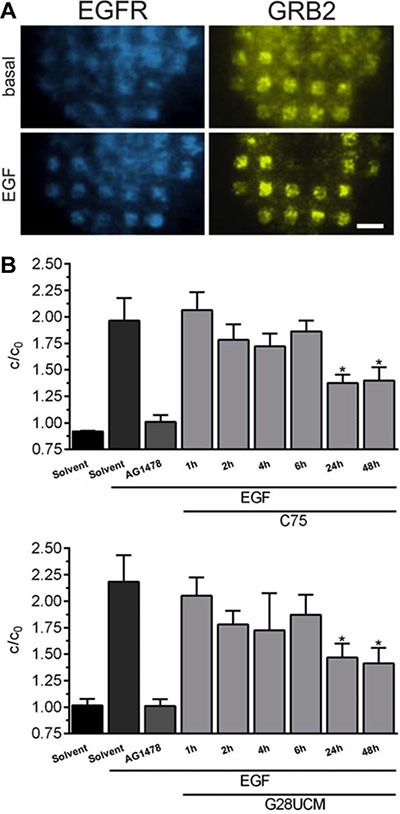
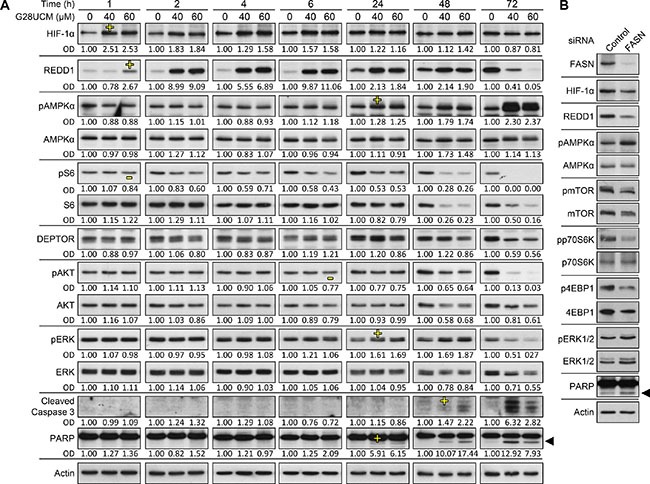
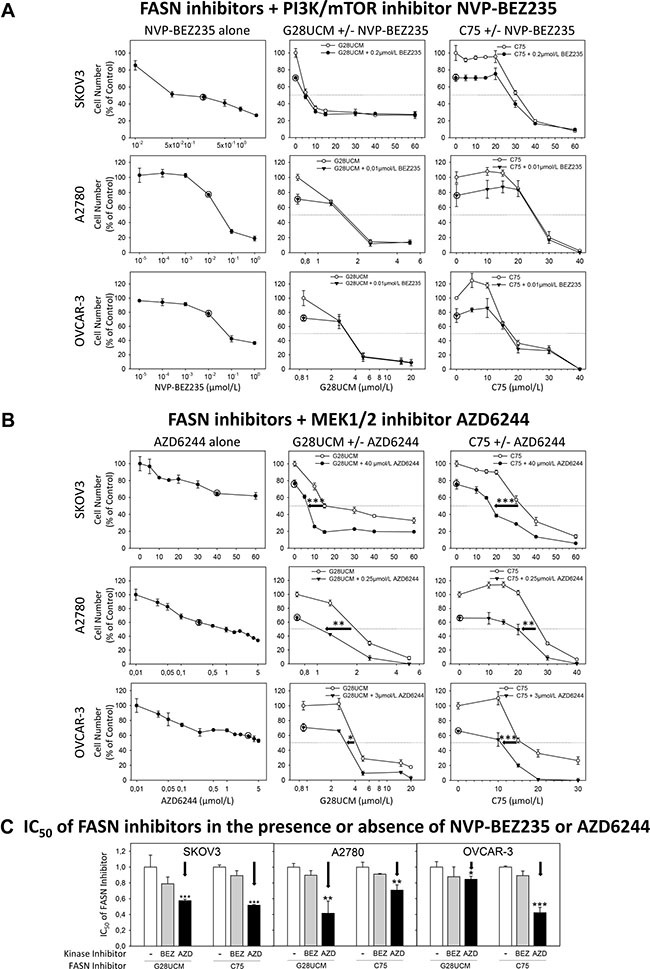
Receptor-PI3K-mTORC1 signaling and fatty acid synthase (FASN)-regulated lipid biosynthesis harbor numerous drug targets and are molecularly connected. We hypothesize that unraveling the mechanisms of pathway cross-talk will be useful for designing novel co-targeting strategies for ovarian cancer (OC). The impact of receptor-PI3K-mTORC1 onto FASN is already well-characterized. However, reverse actions-from FASN towards receptor-PI3K-mTORC1-are still elusive. We show that FASN-blockade impairs receptor-PI3K-mTORC1 signaling at multiple levels. Thin-layer chromatography and MALDI-MS/MS reveals that FASN-inhibitors (C75, G28UCM) augment polyunsaturated fatty acids and diminish signaling lipids diacylglycerol (DAG) and phosphatidylinositol 3,4,5-trisphosphate (PIP3) in OC cells (SKOV3, OVCAR-3, A2780, HOC-7). Western blotting and micropatterning demonstrate that FASN-blockers impair phosphorylation/expression of EGF-receptor/ERBB/HER and decrease GRB2-EGF-receptor recruitment leading to PI3K-AKT suppression. FASN-inhibitors activate stress response-genes HIF-1α-REDD1 (RTP801/DIG2/DDIT4) and AMPKα causing mTORC1- and S6-repression. We conclude that FASN-inhibitor-mediated blockade of receptor-PI3K-mTORC1 occurs due to a number of distinct but cooperating processes. Moreover, decrease of PI3K-mTORC1 abolishes cross-repression of MEK-ERK causing ERK activation. Consequently, the MEK-inhibitor selumetinib/AZD6244, in contrast to the PI3K/mTOR-inhibitor dactolisib/NVP-BEZ235, increases growth inhibition when given together with a FASN-blocker. We are the first to provide deep insight on how FASN-inhibition blocks ERBB-PI3K-mTORC1 activity at multiple molecular levels. Moreover, our data encourage therapeutic approaches using FASN-antagonists together with MEK-ERK-inhibitors.

Keywords: AMPK; REDD1; fatty acid synthase (FASN); lipids; mTORC1.


Conflict of interest statement

CONFLICTS OF INTEREST

The authors have no potential conflicts of interest.

Figures

Figure 1
Figure 1. The degrees of accumulation of malonyl-CoA and depletion of oleic acid (OA) upon inhibition of fatty acid synthase (FASN) in ovarian cancer (OC) cells depend on the particular inhibitors used
(A) Malonyl-CoA is quickly and strongly accumulated by G28UCM, but much less by C75. (B) Supplementation of OA, unlike PA, antagonizes C75-mediated growth inhibition more efficiently than G28UCM-mediated growth inhibition. Data obtained after exposure to C75 (80 μM for SKOV3 and HOC-7, 40 μM for OVCAR-3) or G28UCM (80 μM for SKOV3, 15 μM for OVCAR-3, 30 μM for HOC-7) ± 70 μM OA or PA are presented. 1.5 × 10³ (SKOV3, OVCAR-3) or 0.5 × 10³ (HOC-7) cells/well were seeded in a 96 well plate and treated for 72 h. Note: In these experiments cultures contained bovine serum albumin (for details of dissolving fatty acids see Materials and methods), which lowers the efficacy of FASN-inhibitors [38]. Therefore, higher concentrations of C75 and G28UCM had to be applied in order to achieve marked inhibition of cell growth. Data from untreated controls (not shown in chart) were set to 100% and those from treated cultures were related to it. Means ± SD, n = 3. *p < 0.05, **p < 0.01, ***p < 0.001 FASN-inhibitor alone vs. FASN-inhibitor combined with OA or PA. One-way ANOVA and Scheffe-test. (C) C75 is a weak inducer of apoptosis compared to G28UCM. Moreover, OA fully abrogates C75-induced cell death, but only partially inhibits G28UCM-mediated apoptosis. Means ± SD, n = 3. **p < 0.01, ***p < 0.001 treated vs. untreated control (dashed horizontal line at y = 1). °°p < 0.01, °°°p < 0.001 FASN-inhibitor alone vs. FASN-inhibitor combined with OA or PA. One-way ANOVA and Scheffe-test. (D) Growth inhibition of OC cells after 72 h exposure to TOFA, an inhibitor of acetyl-CoA carboxylase.
Figure 2
Figure 2. Large fluctuations of DAG upon inhibition of FASN by G28UCM as demonstrated by thin-layer chromatography in SKOV3 (left) and OVCAR-3 (right)
Values represent % change of total DAG in treated cells relative to untreated control cells (horizontal 0-line). Means ± SD, n = 3. *p < 0.05, **p < 0.01 vs. control cells, one-way ANOVA and Scheffe-test.
Figure 3
Figure 3. FASN-inhibitors G28UCM and C75 down-regulate total phosphatidylinositol (PI) levels and alter the composition of individual PI species in SKOV3 (upper row-A, C, E) and OVCAR-3 (lower row-B, D, F) cells as demonstrated by MALDI-QIT-TOF-MS/MS analysis
(A, B) Time-course analyses revealed similar ‘bi-phasic response profiles’ of total PI in both cell lines with initial up-regulation at 8 h followed by sharp reductions at 24 and 72 h of exposure to G28UCM relative to untreated control cells (horizontal 0-line). (C, D) Long-term reduction of PI levels after 72 h treatment was less pronounced in SKOV3 (C) than in OVCAR-3 cells (D). ISD internal lipid standards. (E, F) Similar drug-induced changes in the composition of individual PI species were seen after 72 h in both SKOV3 (E) and OVCAR-3 (F) cells including reduction of MUFAs (e.g. OA, 18:1) and enrichment of PUFAs (e.g. arachidonic acid, 20:4). C75 and G28UCM were applied at concentrations that block growth by 60–70% after 72 h (40 μM for SKOV3 and 20 μM for OVCAR-3) [16]. For further details see also Supplementary Table 1. Means ± SD, n = 3. *p < 0.05, **p < 0.01 vs. untreated control cells, one-way ANOVA and Scheffe-test.
Figure 4
Figure 4. The effects of FASN-inhibitors G28UCM and C75 on the phosphorylated derivatives of phosphatidylinositol [PIP = PI(4)P, PIP2 = PI(4,5)P2, PIP3 = PI(3,4,5)P3] in SKOV3 (upper row A, C, E) and OVCAR-3 (lower row B, D, F) cells as demonstrated by MALDI-QIT-TOF-MS/MS analysis using ‘internal lipid standards’ (ISD) for quantitative evaluation
(A, B) FASN-inhibition causes up-regulation of PIP and/or PIP2 in SKOV3 (A) but down-regulation in OVCAR-3 (B). (C, D) Yet, similar drug-induced changes in composition of PIP2 were seen in both cell lines including depletion of lipids containing 18 : 1 and enrichment of those containing 20 : 4 fatty acids. The most prominent fatty acid residues esterified to the sn-2 position of the glycerol backbone of the PIP2 molecules are indicated. Culture conditions were as in Figure 3. (E, F) Exposure for 24 h to FASN-inhibitors C75, (−)C75, or G28UCM down-regulates the amount of PIP3 in SKOV3 (E) and OVCAR-3 (F) cells relative to vehicle control (< 0.1% DMSO) as demonstrated by a competitive PIP3 mass ELISA. Means ± SD, n = 3. *p < 0.05, **p < 0.01, ***p < 0.001 vs. vehicle control cells, one-way ANOVA followed by Scheffe test (A–D and F) or Student‘s t test (E).
Figure 5
Figure 5. FASN-inhibitors C75 and G28UCM counteract EGF-induced recruitment of GRB2 to EGFR
(A) Representative total internal reflection fluorescence microscopy images of a SKOV3 cell co-transfected with EGFR-CFP and GRB2-YFP and grown on an anti-EGFR antibody coated micro-biochip showing the specific recruitment of GRB2 to EGFR enriched regions after EGF stimulation (17 nM, 15 min; lower row) relative to basal interaction (upper row). Scale bar = 9 μm. (B) Quantitative evaluation of the YFP fluorescence contrast reveals that pretreatment with FASN-inhibitors (40 μM, 0–48 h) counteracts EGF-induced binding of GRB2 to EGFR in SKOV3 cells. c/c0 describes the ratio of YFP-fluorescence within (c) and between (c0) EGFR enriched regions. Error bars are based on the SE of > 15 analyzed cells from two individual experiments, respectively. *p < 0.05 vs. cells treated with EGF alone, one-way ANOVA and Scheffe-test.
Figure 6
Figure 6. Pharmacologic inhibition or genetic knock-down of FASN impedes PI3K-mTORC1 signaling and induces apoptosis in OC cells as demonstrated by Western blot analysis
(A) G28UCM-treated SKOV3 cells reveal early upregulation of HIF-1α and REDD1 and concurrent inhibition (de-phosphorylation) of the mTORC1 downstream effector ribosomal S6 protein (pS6). Subsequently, REDD1 and pAKT become decreased, whereas pAMPKα gets increased. Levels of pERK peak at 24–48 h. Cleavage products of caspase 3 and PARP1 indicating apoptosis occur after 24 h of treatment. ‘-‘ First indication of down-regulation, ‘+’ first indication of up-regulation. OD optical density of specific band relative to actin band normalized to untreated control cells (0 μM G28UCM). (B) FASN siRNAs abrogate FASN protein expression in A2780 cells 72 h post-transfection and down-regulate HIF-1α, REDD1, pmTOR, mTOR, pp70S6K, p4EBP1, and 4EBP1, whereas levels of pAMPKα, pERK1/2, ERK1/2, and cleaved PARP increase. Actin was used as loading control. ◄cleaved PARP.
Figure 7
Figure 7. HIF-1α-mediated up-regulation of REDD1 and phosphorylation of AMPKalpha(greek symbol) are crucial for the anticancer effect of FASN-inhibitors in OC cells as demonstrated by Western blot analysis (A–C) and formazan dye assay (D)
(A) The HIF-1α inhibitor LW6 prevents G28UCM-mediated up-regulation of HIF-1α and REDD1. SKOV3 (left) or A2780 (right) cells received 2 or 10 μM LW6 for 18 h followed by a 6 h-exposure to 40 or 20 μM G28UCM, respectively. (B, C) REDD1-(B), AMPKα1- and AMPKα2-specific siRNAs (C) dampen the expression of their respective target genes and (B) prevent G28UCM-mediated (40 μM, 4 h) down-regulation of pmTOR in SKOV3 and A2780 cells. OD, optical density of specific band relative to actin band normalized to untreated control cells. (D) siRNA knock-down of REDD1 or AMPKα1,2 alone or together is lowering the growth inhibitory effect of G28UCM (40 μM, 96 h) in SKOV3 and A2780 cells. Means ± SD, n = 3. *p < 0.05, **p < 0.01 target siRNA vs. control siRNA, one-way ANOVA followed by Scheffe test.
Figure 8
Figure 8. The effect of the dual PI3K/mTOR kinase inhibitor dactolisib/NVP-BEZ235 and of the MEK1/2 kinase inhibitor selumetinib/AZD6244 on the anti-proliferative effects of the FASN-blockers G28UCM and C75 as demonstrated by formazan dye assay
SKOV3, A2780 or OVCAR-3 cells were treated for 72 h with NVP-BEZ235 (A) or AZD6244 (B) alone (left charts), or with G28UCM (center charts) or C75 (right charts) alone or together with NVP-BEZ235 or AZD6244. A circle symbol as given in the original manuscript and in the corresponding diagrams marks the fixed concentration of the kinase inhibitors chosen for combination with various doses of the FASN-inhibitors. In (C) a comparison of the relative IC50 values of the FASN-blockers G28UCM and C75 in the absence (arbitrarily set at y = 1) or presence of NVP-BEZ235 (BEZ) or AZD6244 (AZD) is given. Note: only AZD6244 can significantly lower the IC50 values of the FASN-inhibitors G28UCM and C75 (←). Means ± SD, n = 3. *p < 0.05, **p < 0.01, ***p < 0.001 presence (AZD) vs. absence of AZD6244 (−), one-way ANOVA followed by Scheffe test.

Similar articles

Cited by

References

    1. Banks E, Beral V, Reeves G. The epidemiology of epithelial ovarian cancer: a review. Int J Gynecol Cancer. 1997;7:425–438.
    1. Brown PO, Palmer C. The preclinical natural history of serous ovarian cancer: defining the target for early detection. PLoS Med. 2009;6:e1000114. - PMC - PubMed
    1. Siegel R, Ma J, Zou Z, Jemal A. Cancer statistics, 2014. CA Cancer J Clin. 2014;64:9–29. - PubMed
    1. SEER Stat Fact Sheets: Ovary Cancer [online]. Available from: http://seer.cancer.gov/statfacts/html/ovary.html Retrieved on January 19, 2016.
    1. Romero I, Bast RC., Jr Minireview: human ovarian cancer: biology, current management, and paths to personalizing therapy. Endocrinology. 2012;153:1593–1602. - PMC - PubMed

MeSH terms

Substances