. 2017 Jan 12;8(1):e2540.
doi: 10.1038/cddis.2016.461.

MiR-26 enhances chemosensitivity and promotes apoptosis of hepatocellular carcinoma cells through inhibiting autophagy

Affiliations

MiR-26 enhances chemosensitivity and promotes apoptosis of hepatocellular carcinoma cells through inhibiting autophagy

Fangfang Jin et al. Cell Death Dis. .

Abstract

Hepatocellular carcinoma (HCC) generally possesses a high resistance to chemotherapy. Given that autophagy is an important factor promoting tumor chemoresistance and HCC express low level of miR-26, we aim to investigate the functional role of miR-26 in autophagy-mediated chemoresistance of HCC. We found that chemotherapeutic drug doxorubicin (Dox) induced autophagy but decreased the level of miR-26a/b in HCC cells. Activating autophagy using rapamycin can directly downregulate the level of miR-26a/b in HCC cells. In turn, restoring the expression of miR-26a/b inhibited autophagy induced by Dox and promoted apoptosis in HCC cells. Further mechanistic study identified that miR-26a and miR-26b target ULK1, a critical initiator of autophagy, at post-transcriptional level. Results from 30 cases of patients with HCC also showed that tumor cellular levels of miR-26a and miR-26b are significantly downregulated as compared with the corresponding control tissues and negatively correlated with the protein level of ULK1 but are not correlated to the mRNA level of ULK1. Gain- and loss-of-function assay confirmed that miR-26a/b inhibited autophagic flux at the initial stage through targeting ULK1. Overexpression of miR-26a/b enhanced the sensitivity of HCC cells to Dox and promoted apoptosis via inhibiting autophagy in vitro. Using xenograft models in nude mice, we confirmed that miR-26a/b, via inhibiting autophagy, promoted apoptosis and sensitized hepatomas to Dox treatment in vivo. Our findings demonstrate for the first time that miR-26a/b can promote apoptosis and sensitize HCC to chemotherapy via suppressing the expression of autophagy initiator ULK1, and provide the reduction of miR-26a/b in HCC as a novel mechanism of tumor chemoresistance.


Conflict of interest statement

The authors declare no conflict of interest.

Figures
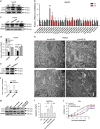
Figure 1
Figure 1
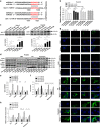
Dox-induced autophagy decreases miR-26a/b levels, and miR-26a/b promotes apoptosis and inhibits viability and proliferation of HCC cells through downregulating autophagy. (a) Representative western blotting analyses of LC3-I and LC3-II in HepG2 cells after treatment with Dox for 24 and 48 h. (b) Relative levels of miRNAs in HepG2 cells after treatment with Dox for 48 h were analyzed using RT-qPCR. (c) Representative western blotting analyses of LC3-I and LC3-II in HepG2 cells after treatment with or without rapamycin, 3-MA and CQ for 24 h. (d) miR-26a/b were detected using RT-qPCR in HepG2 cells after treatment with/without 3-MA, CQ and Rapamycin for 24 h. (e) Protein levels of LC3-I and LC3-II in HepG2 and HepG2/Dox cells. (f) Relative miR-26a/b levels in HepG2, HepG2/Dox cells. (g) Representative western blotting analyses of LC3-I and LC3-II in HepG2/Dox cells transfected with/without miR-26a/b mimics under different treatments for 24 h. (h) The ultrastructure of treated HepG2 cells were observed by electron micrography after 24-h transfection. White arrows showed autophagosomes or autophagosome-fused lysosomes. (i) Apoptosis of HepG2/Dox cells transfected with or without miR-26a/b mimics under various treatments were analyzed. (j) The sensitivities of HepG2 and HepG2/Dox cells under different treatments were determined using a CCK-8 assay. Statistical data are presented as the means±S.E. from three independent experiments. *P<0.05; **P<0.01; and ***P<0.001
Figure 2
Figure 2
MiR-26a/b directly targets ULK1 and inhibits autophagy at the initial stage in HCC cells. (a) A schematic diagram of ULK1 3′-UTR as a putative target for miR-26a/b. The seed-recognizing sites in the ULK1 3′-UTR by miR-26a/b are indicated in red. (b) Relative luciferase activity in 293T that were transfected with firefly luciferase reporters containing WT or mutant 3′-UTRs of ULK1, pre-miR-26a/b or random pre-miR-NC. (c) Huh-7 and HepG2 cells were transfected with pre-miR-NC, pre-miR-26a/b or anti-miR-NC, anti-miR-26a/b. The ULK1 expression level were detected using immunoblotting. (d) HepG2 cells were transfected with pre-miR-NC, pre-miR-26 or anti-miR-26 for 24 h, cells were treated with/without 3-MA, CQ or rapamycin for 24 h. The expression levels of LC3, ULK1, Beclin-1 and ATG7 were detected. (e) Quantitative analysis of ULK1 protein levels. (f) Quantitative analysis of LC3-II/LC3-I protein levels. (g) HepG2 cells were transfected with GFP-LC3 plasmid, pre-miRNA-NC, miR-26a/b mimics, anti-miR-NC or anti-miR-26; after 24-h transfection, cells were treated with 3-MA, CQ or rapamycin for a further 24 h before observation to count GFP-LC3 puncta under confocal microscopy. Blue indicates DAPI-stained nuclei. Green indicates GFP-LC3. One of 10 representative micrographs is shown. (h) The relative number of GFP-LC3 punctae in cells treated with 3-MA, CQ or rapamycin was calculated from 10 random fields. The data are presented as the means±S.E. obtained from three independent experiments. *P<0.05; **P<0.01; and ***P<0.001
Figure 3
Figure 3
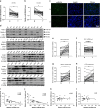
MiR-26a/b regulates autophagy through targeting ULK1. (a) Protein levels of ULK1 and LC3 were determined in HepG2 cells overexpressed with pre-miR-NC, pre-miR-26, ULK1-vector or pre-miR-26 plus ULK1-expressing plasmids. GAPDH was served as internal control. The right histograms represent quantitative analysis of ULK1 and LC3-II/LC3-I protein level. (b) Representative photographs of HepG2 cells transfected with GFP-LC3-expressing plasmids plus pre-miR-NC, pre-miR-26, ULK1-vector or pre-miR-26+ULK1-vector. (c) Protein levels of ULK1 and LC3 were detected in HepG2 cells overexpressed with anti-miR-NC, anti-miR-26, Si-ULK1 or anti-miR-26 plus Si-ULK1. (d) Representative photographs of HepG2 cells transfected with GFP-LC3-expressing plasmids plus anti-miR-NC, anti-miR-26, Si-ULK1 or anti-miR-26+Si-ULK1. The right histogram represents quantitative analysis of GFP-LC3 punctate from 10 micrographs. *P<0.05; **P<0.01; and ***P<0.001
Figure 4
Figure 4
MiR-26a/b is inversely correlated with increased autophagy in tumor tissues of patients with HCC. (ac) Relative levels of miR-26a/b (expressed as the miRNA/U6 ratio) in tumor tissues (T) and the corresponding background livers (N) were determined using RT-qPCR and in situ hybridization assays. Data are shown as the means±S.E.M.; n=30 in each group. (d) Protein levels of ULK1, Beclin-1 and ATG7 were determined using western blotting in 30 pairs of samples. GAPDH was used as an internal control. (eh) Quantitative analyses of the protein and mRNA levels of ULK1, Beclin-1 and ATG7 in 30 pairs of HCC samples. (il) Pearson's correlation scatter plot of the fold changes of miR-26a/b and ULK1 protein, mRNA in HCC tissues. *P<0.05; **P<0.01; and ***P<0.001
Figure 5
Figure 5
MiR-26a/b enhances the sensitivity of HCC cells to chemotherapeutic drugs and promotes HCC apoptosis by inhibiting autophagy in vitro. (a) Representative western blotting analyses of ULK1 in HepG2 cells after treatment with Dox over time. (b) Different expression levels of ULK1 in HepG2 and HepG2/Dox cells. (c) ULK1 levels in HepG2/Dox cells transfected with/without miR-26 mimics under different treatments. (d) HepG2 cells transfected with pre-miR-NC, pre-miR-26, ULK1-vector or pre-miR-26 plus ULK1-vector, treated with/without Dox. Protein levels of ULK1 and LC3 were determined. (e) Representative photographs of HepG2 cells transfected with GFP-LC3-expressing plasmids plus pre-miR-NC, pre-miR-26, ULK1-vector or pre-miR-26+ULK1-vector, treated with/without Dox. The right-hand histogram represents a quantitative analysis of GFP-LC3 punctae from 10 micrographs. (f and g) Cell viabilities of HepG2 cells under different treatments were determined using a CCK-8 assay at various time points. (h) Cell apoptosis of HepG2 cells under various treatments was analyzed using flow cytometry. (i) The sensitivities of HepG2 cells under different transfections with Dox were determined using a CCK-8 assay. *P<0.05; **P<0.01; and ***P<0.001
Figure 6
Figure 6
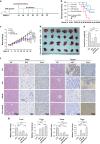
Intravenous injections of miR-26a/b-expressing lentivirus enhance the efficiency of chemotherapeutic drugs by blocking the growth of tumor in vivo. (a) A schematic diagram illustrating the experimental design. The HCC mouse model was constructed using HepG2 cells. Intravenous delivery of miR-26a/b-expressing lentivirus started at 3 weeks after orthotopic liver implantation in nude mice (day 0). Then, mice were administered with PBS or Dox every 3 days. Mice were divided into four groups according to the treatments: PBS (CTL), Lenti-miR-26 (miR-26), Dox and Dox plus Lenti-miR-26 (DOX+miR-26). (b) Survival analysis. (c)The time course of body weight. (d) Tumors at the week 5. (e) The quantitative analysis of tumor and liver weights. (f) HE, Ki67 and Tunel staining of tumor and liver sections obtained from the four mouse groups. (g) The histograms represent quantitative analyses of Ki67 and Tunel-positive signals in the tumor and liver sections. All data are shown as the means±S.E. obtained from three separate experiments. *P<0.05; **P<0.01; and ***P<0.001
Figure 7
Figure 7
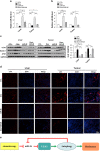
Intravenous injections of miR-26a/b-expressing lentivirus enhance the efficiency of chemotherapeutic drugs by inhibiting autophagy in vivo. (a and b) Quantitative analysis of miR-26a/b levels in tumors and livers of four mouse groups. (c) Western blotting analyses of ULK1, Beclin-1 and ATG7 proteins in the tumors and livers of mice that were treated with PBS, Lenti-miR-26, Dox or Dox plus Lenti-miR-26. (d) Representative micrographs of the immunofluorescence staining of LC3 puncta in tumor and liver tissues. Red indicates LC3; blue indicates nuclei. (e) Schematic illustrating how miR-26 induces chemosensitivity to drugs. MiR-26 inhibits autophagy and sensitize tumor cells to chemotherapy by suppressing ULK1 and downstream events. Pointed arrows and blunted arrows indicate activation and repression, respectively. *P<0.05; **P<0.01; and ***P<0.001

Similar articles

Cited by

References

    1. Jemal A, Bray F, Center MM, Ferlay J, Ward E, Forman D. Global Cancer Statistics. CA-Cancer J Clin 2011; 61: 69–90. - PubMed
    1. Varela M, Real MI, Burrel M, Forner A, Sala M, Brunet M et al. Chemoembolization of hepatocellular carcinoma with drug eluting beads: Efficacy and doxorubicin pharmacokinetics. J Hepatol 2007; 46: 474–481. - PubMed
    1. Gottesman MM. Mechanisms of cancer drug resistance. Annu Rev Med 2002; 53: 615–627. - PubMed
    1. Yang ZNJ, Chee CE, Huang SB, Sinicrope FA. The role of autophagy in cancer: therapeutic implications. Mol Cancer Ther 2011; 10: 1533–1541. - PMC - PubMed
    1. White E, Karp C, Strohecker AM, Guo YX, Mathew R. Role of autophagy in suppression of inflammation and cancer. Curr Opin Cell Biol 2010; 22: 212–217. - PMC - PubMed

Publication types

MeSH terms