The biological properties of different Epstein-Barr virus strains explain their association with various types of cancers
- PMID: 28052012
- PMCID: PMC5354655
- DOI: 10.18632/oncotarget.14380
The biological properties of different Epstein-Barr virus strains explain their association with various types of cancers
Abstract
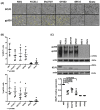
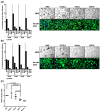
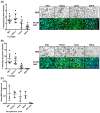
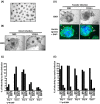
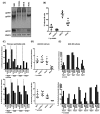
The Epstein-Barr virus (EBV) is etiologically associated with the development of multiple types of tumors, but it is unclear whether this diversity is due to infection with different EBV strains. We report a comparative characterization of SNU719, GP202, and YCCEL1, three EBV strains that were isolated from gastric carcinomas, M81, a virus isolated in a nasopharyngeal carcinoma and several well-characterized laboratory type A strains. We found that B95-8, Akata and GP202 induced cell growth more efficiently than YCCEL1, SNU719 and M81 and this correlated positively with the expression levels of the viral BHRF1 miRNAs. In infected B cells, all strains except Akata and B95-8 induced lytic replication, a risk factor for carcinoma development, although less efficiently than M81. The panel of viruses induced tumors in immunocompromised mice with variable speed and efficacy that did not strictly mirror their in vitro characteristics, suggesting that additional parameters play an important role. We found that YCCEL1 and M81 infected primary epithelial cells, gastric carcinoma cells and gastric spheroids more efficiently than Akata or B95-8. Reciprocally, Akata and B95-8 had a stronger tropism for B cells than YCCEL1 or M81. These data suggest that different EBV strains will induce the development of lymphoid tumors with variable efficacy in immunocompromised patients and that there is a parallel between the cell tropism of the viral strains and the lineage of the tumors they induce. Thus, EBV strains can be endowed with properties that will influence their transforming abilities and the type of tumor they induce.
Keywords: Epstein-Barr virus strains; carcinoma and lymphoma; host-virus interactions; human tumor viruses; viral infection and transformation.
Conflict of interest statement
The authors declare no potential conflicts of interests.
Figures


Similar articles
-
Efficient Translation of Epstein-Barr Virus (EBV) DNA Polymerase Contributes to the Enhanced Lytic Replication Phenotype of M81 EBV.J Virol. 2018 Feb 26;92(6):e01794-17. doi: 10.1128/JVI.01794-17. Print 2018 Mar 15. J Virol. 2018. PMID: 29263273 Free PMC article.
-
Identification and Cloning of a New Western Epstein-Barr Virus Strain That Efficiently Replicates in Primary B Cells.J Virol. 2020 May 4;94(10):e01918-19. doi: 10.1128/JVI.01918-19. Print 2020 May 4. J Virol. 2020. PMID: 32102884 Free PMC article.
-
EBV Infection and Glucose Metabolism in Nasopharyngeal Carcinoma.Adv Exp Med Biol. 2017;1018:75-90. doi: 10.1007/978-981-10-5765-6_6. Adv Exp Med Biol. 2017. PMID: 29052133 Review.
-
Carcinoma-risk variant of EBNA1 deregulates Epstein-Barr Virus episomal latency.Oncotarget. 2017 Jan 31;8(5):7248-7264. doi: 10.18632/oncotarget.14540. Oncotarget. 2017. PMID: 28077791 Free PMC article.
-
Role of Viral and Host microRNAs in Immune Regulation of Epstein-Barr Virus-Associated Diseases.Front Immunol. 2020 Mar 3;11:367. doi: 10.3389/fimmu.2020.00367. eCollection 2020. Front Immunol. 2020. PMID: 32194570 Free PMC article. Review.
Cited by
-
Recent Advances in Assessing the Clinical Implications of Epstein-Barr Virus Infection and Their Application to the Diagnosis and Treatment of Nasopharyngeal Carcinoma.Microorganisms. 2023 Dec 20;12(1):14. doi: 10.3390/microorganisms12010014. Microorganisms. 2023. PMID: 38276183 Free PMC article. Review.
-
Epstein-Barr Virus (EBV) Is Mostly Latent and Clonal in Angioimmunoblastic T Cell Lymphoma (AITL).Cancers (Basel). 2022 Jun 12;14(12):2899. doi: 10.3390/cancers14122899. Cancers (Basel). 2022. PMID: 35740565 Free PMC article.
-
Intra-host changes in Kaposi sarcoma-associated herpesvirus genomes in Ugandan adults with Kaposi sarcoma.PLoS Pathog. 2021 Jan 19;17(1):e1008594. doi: 10.1371/journal.ppat.1008594. eCollection 2021 Jan. PLoS Pathog. 2021. PMID: 33465147 Free PMC article.
-
Virus-specific T cells for malignancies - then, now and where to?Curr Stem Cell Rep. 2020 Jun;6(2):17-29. doi: 10.1007/s40778-020-00170-6. Epub 2020 May 7. Curr Stem Cell Rep. 2020. PMID: 33738181 Free PMC article.
-
CAR-T Cells Targeting Epstein-Barr Virus gp350 Validated in a Humanized Mouse Model of EBV Infection and Lymphoproliferative Disease.Mol Ther Oncolytics. 2020 Aug 8;18:504-524. doi: 10.1016/j.omto.2020.08.005. eCollection 2020 Sep 25. Mol Ther Oncolytics. 2020. PMID: 32953984 Free PMC article.
References
-
- Rickinson AB, Kieff E. Epstein-Barr virus. In: Knipe DM, Howley PM, Griffin DE, Lamb RA, Martin MA, Roizman B, Straus SE, editors. Fields Virology. Philadelphia: Lippincott Williams & Wilkins; (2007. pp. 2655–2700.
-
- Hsu WL, Chen JY, Chien YC, Liu MY, You SL, Hsu MM, Yang CS, Chen CJ. Independent effect of EBV and cigarette smoking on nasopharyngeal carcinoma: a 20-year follow-up study on 9,622 males without family history in Taiwan. Cancer epidemiology, biomarkers & prevention. 2009;18:1218–1226. - PubMed
-
- Jia WH, Qin HD. Non-viral environmental risk factors for nasopharyngeal carcinoma: a systematic review. Seminars in cancer biology. 2012;22:117–126. - PubMed
Publication types
MeSH terms
Substances
LinkOut - more resources
Full Text Sources
Other Literature Sources
Medical

