

Induction of miR-96 by Dietary Saturated Fatty Acids Exacerbates Hepatic Insulin Resistance through the Suppression of INSR and IRS-1
- PMID: 28036389
- PMCID: PMC5201257
- DOI: 10.1371/journal.pone.0169039
Induction of miR-96 by Dietary Saturated Fatty Acids Exacerbates Hepatic Insulin Resistance through the Suppression of INSR and IRS-1
Abstract
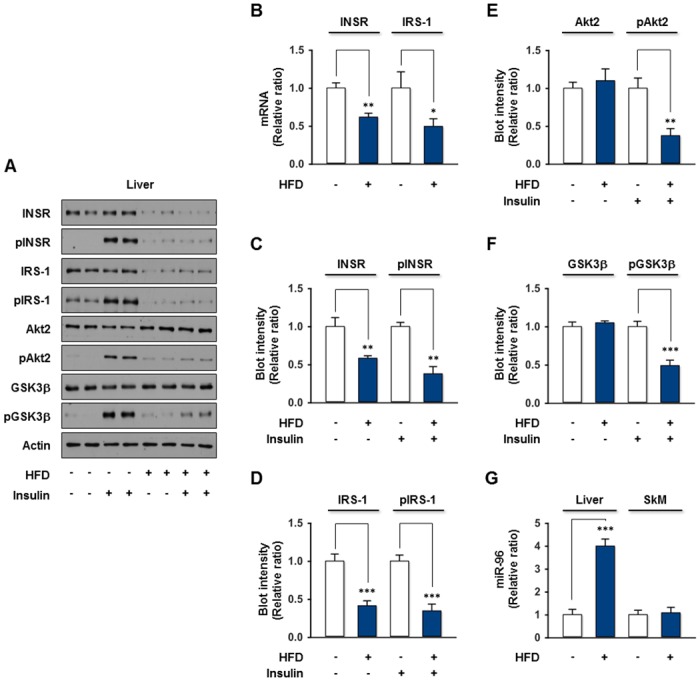
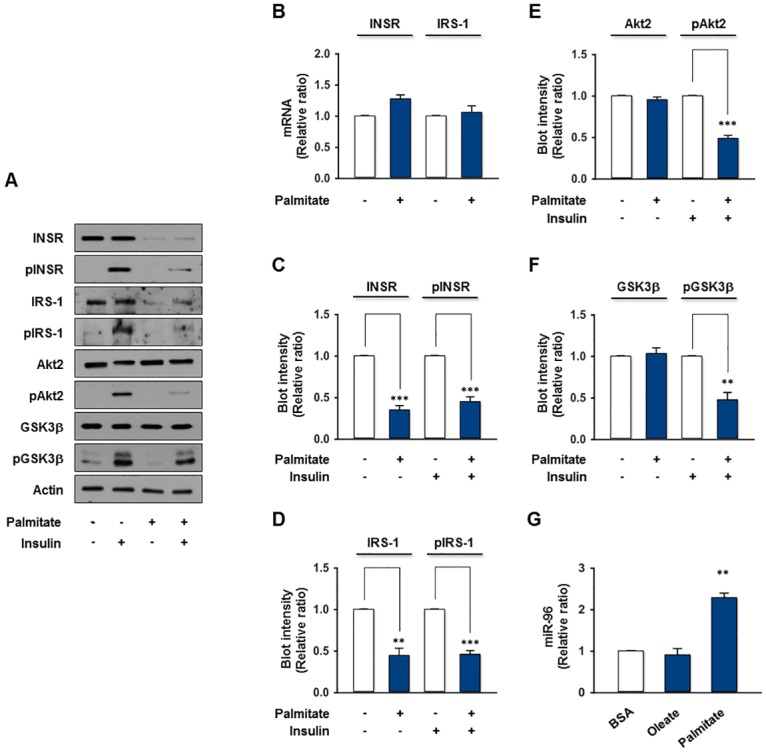
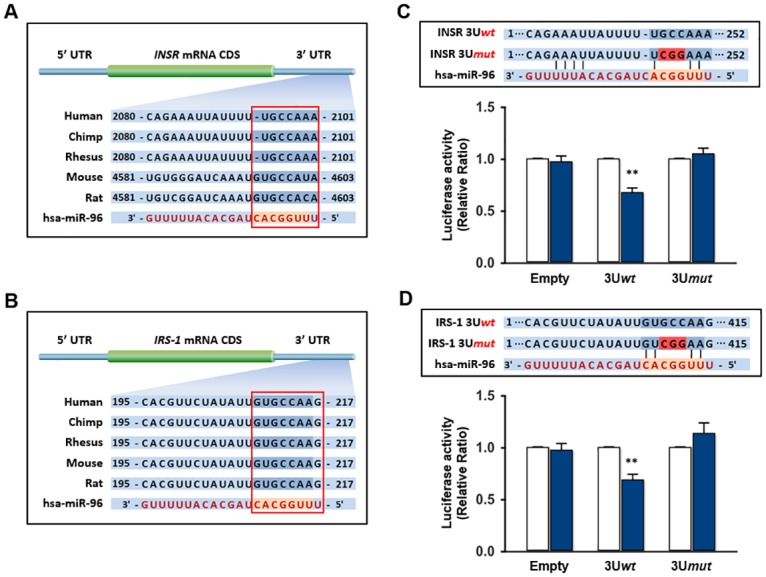
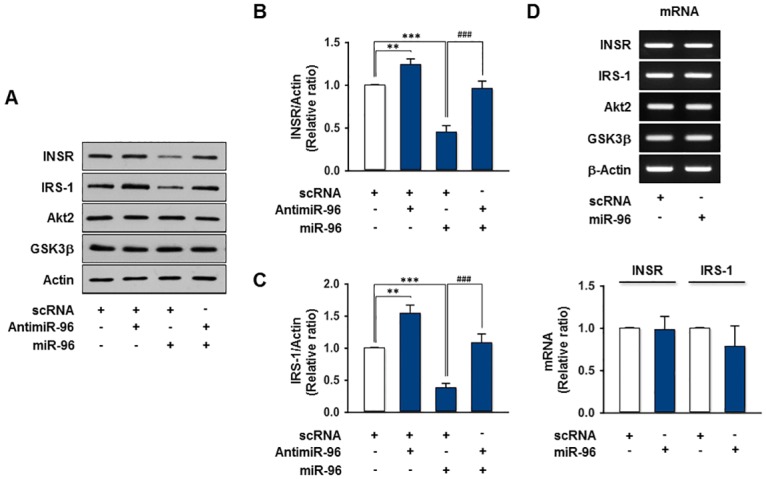
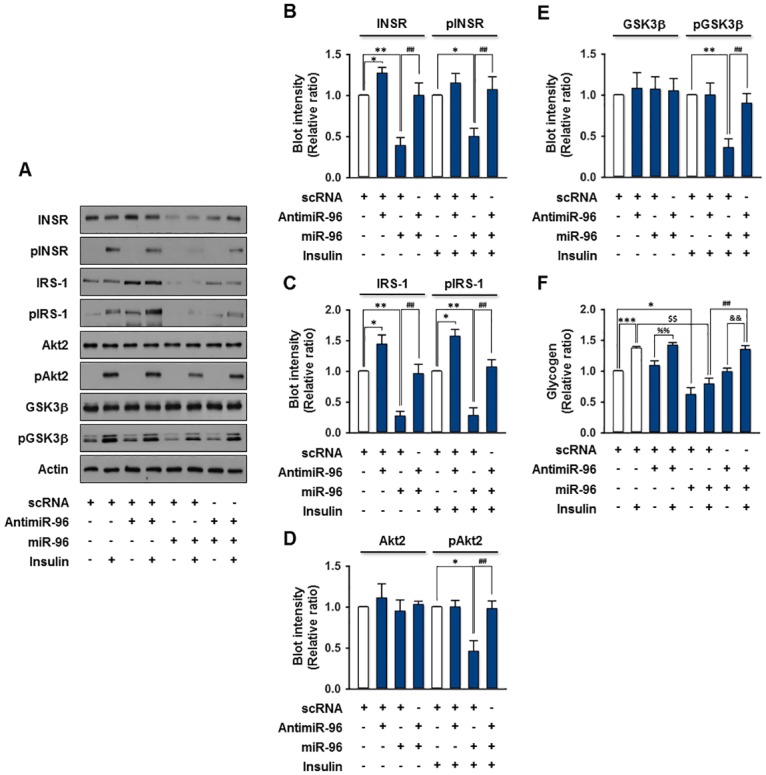
Obesity is defined as the excessive accumulation of body fat that ultimately leads to chronic metabolic diseases. Diets rich in saturated fatty acids (SFA) exacerbate obesity and hepatic steatosis, which increase the risk of hepatic insulin resistance and type 2 diabetes (T2DM). Although microRNAs (miRNAs) play an important role in a range of biological processes, the implications of SFA-induced miRNAs in metabolic dysregulation, particularly in the pathogenesis of hepatic insulin resistance, are not well understood. This study investigated the implications of miR-96, which is induced strongly by SFA, in the development of hepatic insulin resistance. The liver of HFD mice and the palmitate-treated hepatocytes exhibited an impairment of insulin signaling due to the significant decrease in INSR and IRS-1 expression. According to expression profiling and qRT-PCR analysis of the miRNAs, the expression level of miR-96 was higher in hepatocytes treated with palmitate. Moreover, miR-96 was also upregulated in the liver of HFD mice. Interestingly, miR-96 targeted the 3'UTRs of INSR and IRS-1 directly, and repressed the expression of INSR and IRS-1 at the post-transcriptional level. Accordingly, the overexpression of miR-96 was found to cause a significant decrease in INSR and IRS-1 expression, thereby leading to an impairment of insulin signaling and glycogen synthesis in hepatocytes. These results reveal a novel mechanism whereby miR-96 promotes the pathogenesis of hepatic insulin resistance resulted from SFA or obesity.
Conflict of interest statement
The authors have declared that no competing interests exist.
Figures
Similar articles
-
MiR-1271 upregulated by saturated fatty acid palmitate provokes impaired insulin signaling by repressing INSR and IRS-1 expression in HepG2 cells.Biochem Biophys Res Commun. 2016 Sep 30;478(4):1786-91. doi: 10.1016/j.bbrc.2016.09.029. Epub 2016 Sep 7. Biochem Biophys Res Commun. 2016. PMID: 27613089
-
Saturated fatty acids-induced miR-424-5p aggravates insulin resistance via targeting insulin receptor in hepatocytes.Biochem Biophys Res Commun. 2018 Sep 10;503(3):1587-1593. doi: 10.1016/j.bbrc.2018.07.084. Epub 2018 Jul 20. Biochem Biophys Res Commun. 2018. PMID: 30033101
-
Obesity-induced miR-15b is linked causally to the development of insulin resistance through the repression of the insulin receptor in hepatocytes.Mol Nutr Food Res. 2015 Nov;59(11):2303-14. doi: 10.1002/mnfr.201500107. Epub 2015 Aug 12. Mol Nutr Food Res. 2015. PMID: 26179126
-
Cardio-Metabolic Effects of High-Fat Diets and Their Underlying Mechanisms-A Narrative Review.Nutrients. 2020 May 21;12(5):1505. doi: 10.3390/nu12051505. Nutrients. 2020. PMID: 32455838 Free PMC article. Review.
-
Regulatory Roles of MicroRNAs in Diabetes.Int J Mol Sci. 2016 Oct 17;17(10):1729. doi: 10.3390/ijms17101729. Int J Mol Sci. 2016. PMID: 27763497 Free PMC article. Review.
Cited by
-
Association of single nucleotide polymorphisms of miRNAs involved in the GLUT4 pathway in T2DM in a Chinese population.Mol Genet Genomic Med. 2019 Sep;7(9):e907. doi: 10.1002/mgg3.907. Epub 2019 Aug 7. Mol Genet Genomic Med. 2019. PMID: 31389668 Free PMC article. Clinical Trial.
-
Insulin action at a molecular level - 100 years of progress.Mol Metab. 2021 Oct;52:101304. doi: 10.1016/j.molmet.2021.101304. Epub 2021 Jul 15. Mol Metab. 2021. PMID: 34274528 Free PMC article. Review.
-
MicroRNAs: The Link between the Metabolic Syndrome and Oncogenesis.Int J Mol Sci. 2021 Jun 13;22(12):6337. doi: 10.3390/ijms22126337. Int J Mol Sci. 2021. PMID: 34199293 Free PMC article. Review.
-
microRNA-802 is involved in palmitate-induced damage to pancreatic β cells through repression of sirtuin 6.Int J Clin Exp Pathol. 2017 Nov 1;10(11):11300-11307. eCollection 2017. Int J Clin Exp Pathol. 2017. PMID: 31966484 Free PMC article.
-
MicroRNA-219 decreases hippocampal long-term potentiation inhibition and hippocampal neuronal cell apoptosis in type 2 diabetes mellitus mice by suppressing the NMDAR signaling pathway.CNS Neurosci Ther. 2019 Jan;25(1):69-77. doi: 10.1111/cns.12981. Epub 2018 May 27. CNS Neurosci Ther. 2019. PMID: 29804319 Free PMC article.
References
-
- Boren J, Taskinen MR, Olofsson SO, Levin M. Ectopic lipid storage and insulin resistance: a harmful relationship. J Intern Med. 2013;274(1):25–40. Epub 2013/04/05. - PubMed
MeSH terms
Substances
Grants and funding
LinkOut - more resources
Full Text Sources
Other Literature Sources
Medical
Molecular Biology Databases
Miscellaneous
