

Evolution of Chemosensory Gene Families in Arthropods: Insight from the First Inclusive Comparative Transcriptome Analysis across Spider Appendages
- PMID: 28028122
- PMCID: PMC5381604
- DOI: 10.1093/gbe/evw296
Evolution of Chemosensory Gene Families in Arthropods: Insight from the First Inclusive Comparative Transcriptome Analysis across Spider Appendages
Abstract
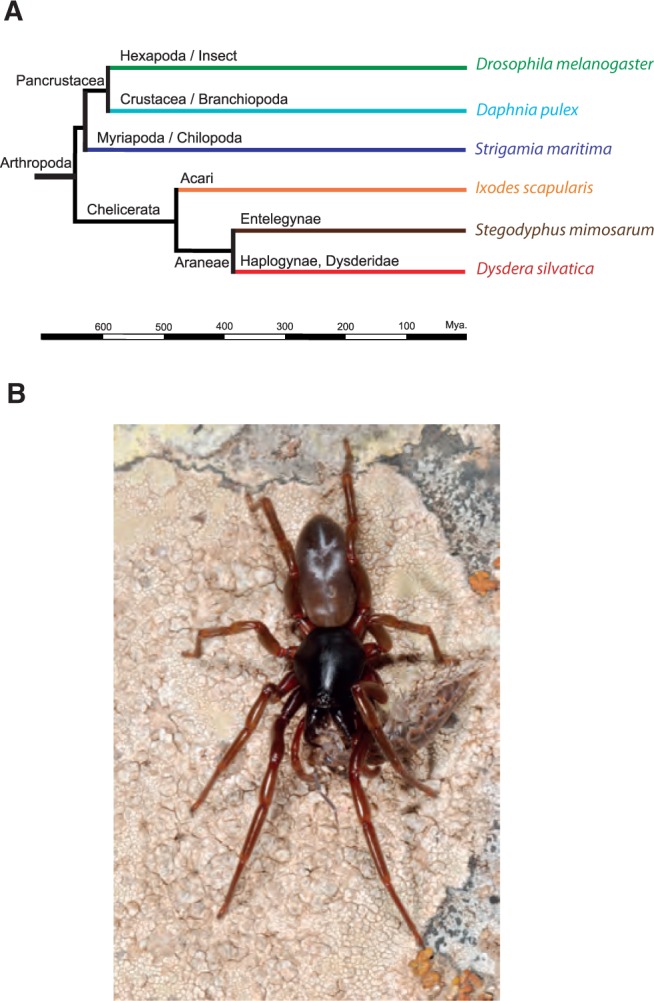
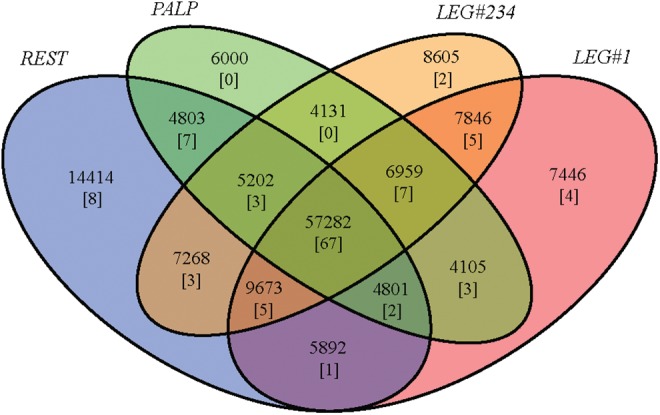
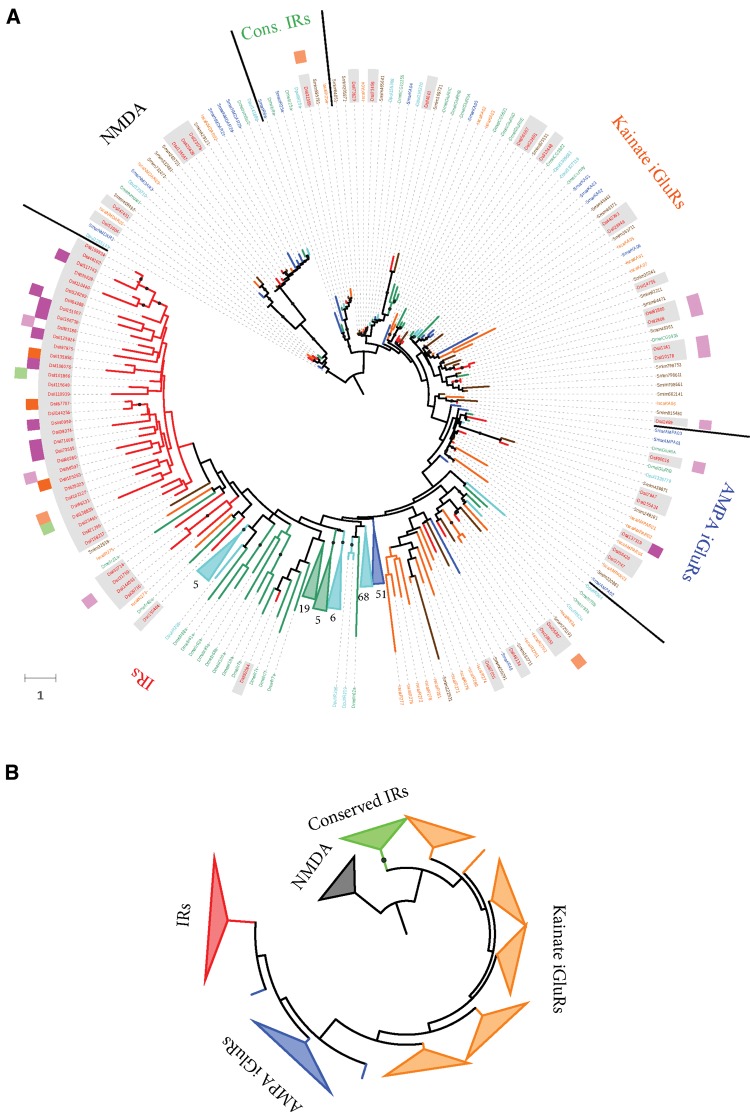
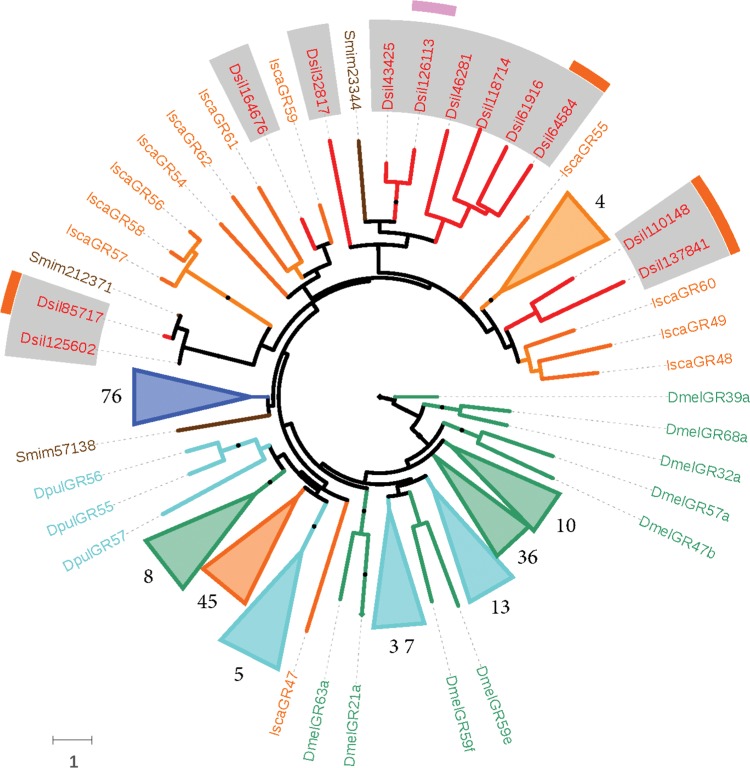
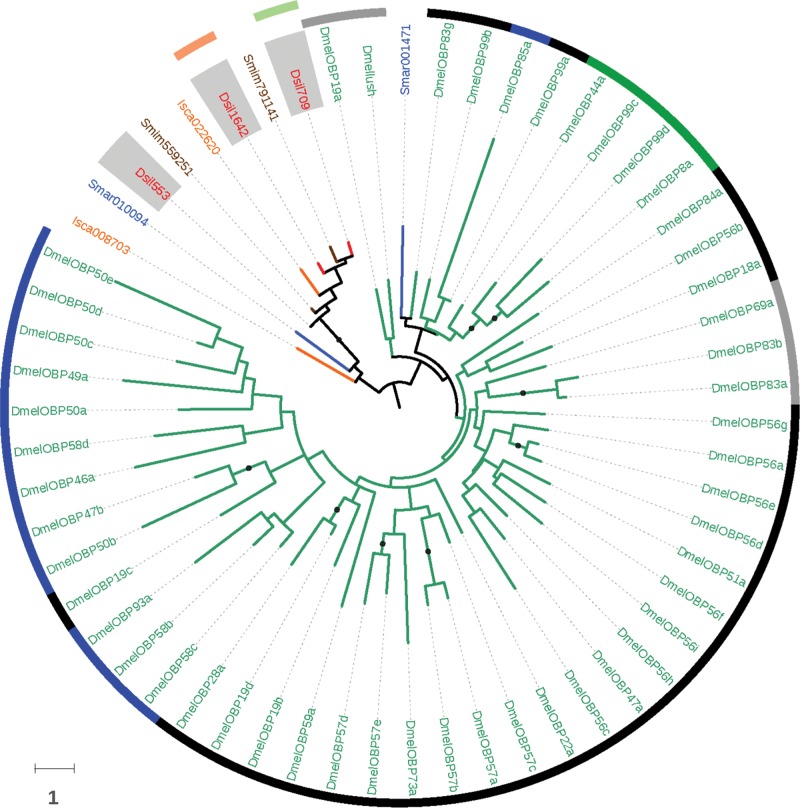
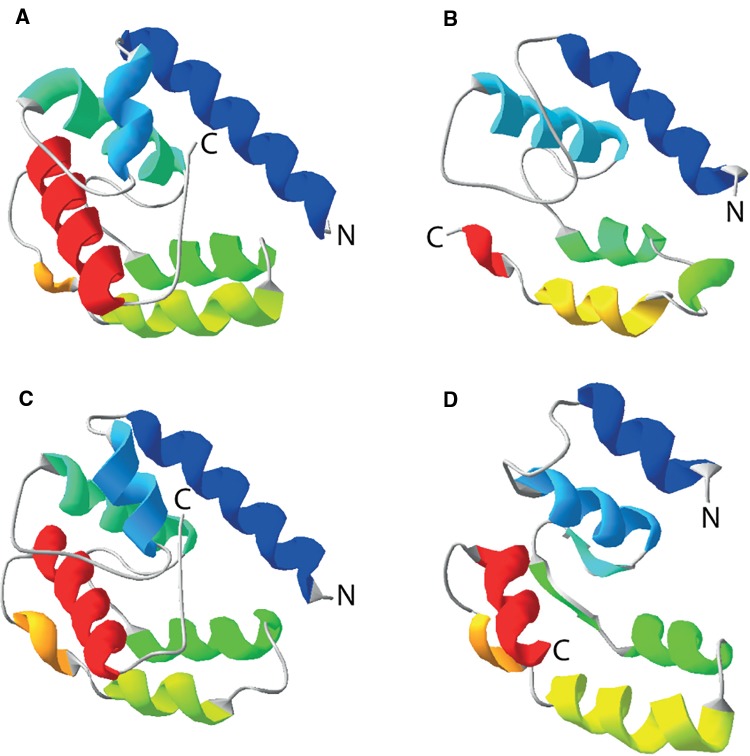
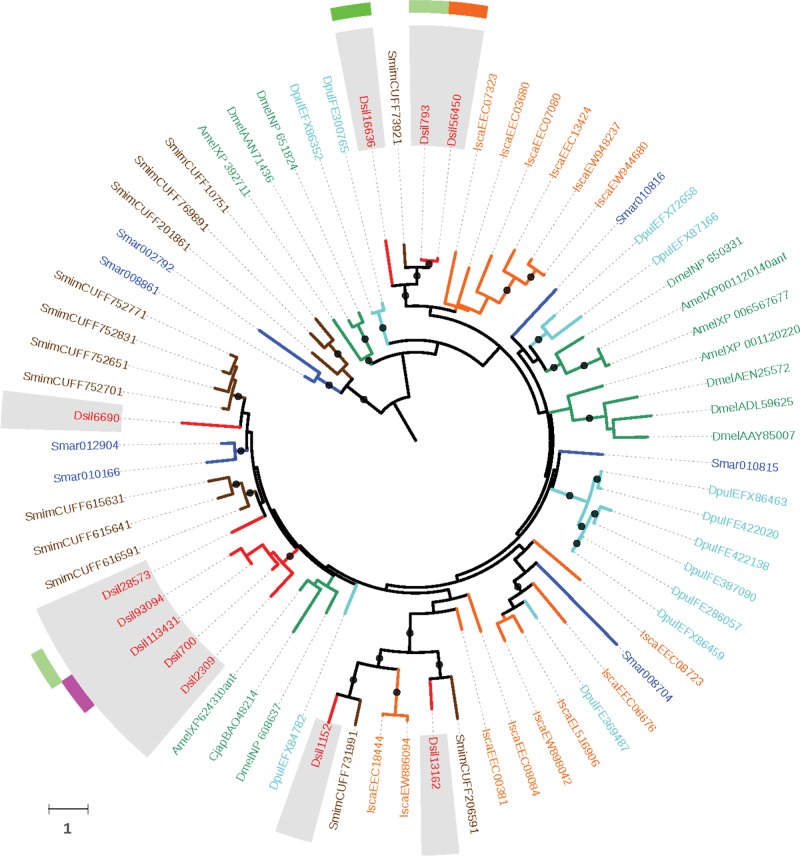
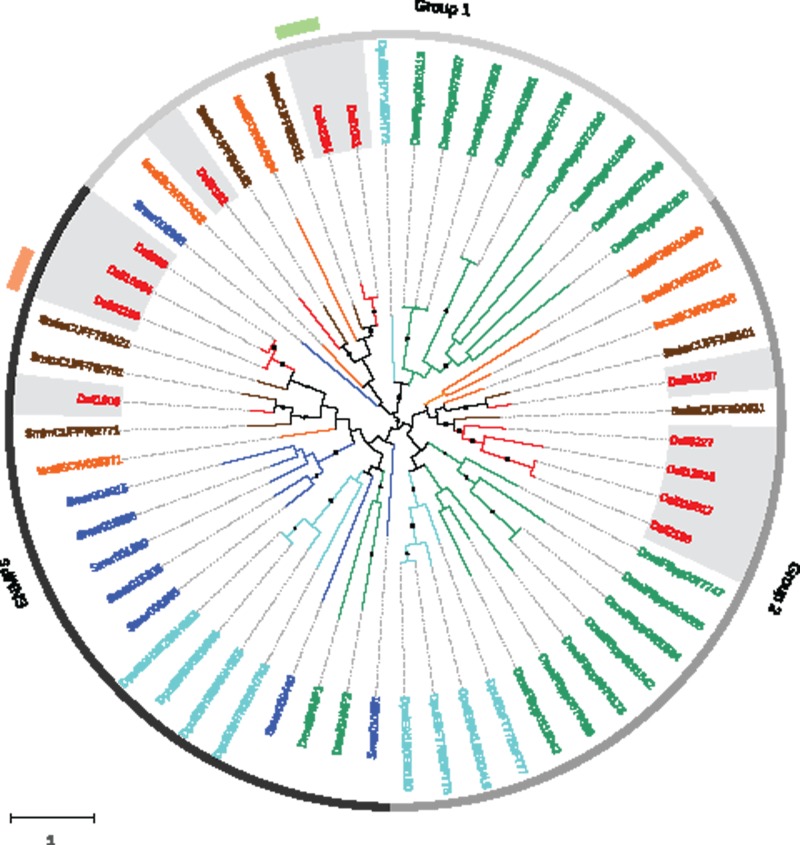
Unlike hexapods and vertebrates, in chelicerates, knowledge of the specific molecules involved in chemoreception comes exclusively from the comparative analysis of genome sequences. Indeed, the genomes of mites, ticks and spiders contain several genes encoding homologs of some insect membrane receptors and small soluble chemosensory proteins. Here, we conducted for the first time a comprehensive comparative RNA-Seq analysis across different body structures of a chelicerate: the nocturnal wandering hunter spider Dysdera silvatica Schmidt 1981. Specifically, we obtained the complete transcriptome of this species as well as the specific expression profile in the first pair of legs and the palps, which are thought to be the specific olfactory appendages in spiders, and in the remaining legs, which also have hairs that have been morphologically identified as chemosensory. We identified several ionotropic (Ir) and gustatory (Gr) receptor family members exclusively or differentially expressed across transcriptomes, some exhibiting a distinctive pattern in the putative olfactory appendages. Furthermore, these IRs were the only known olfactory receptors identified in such structures. These results, integrated with an extensive phylogenetic analysis across arthropods, uncover a specialization of the chemosensory gene repertoire across the body of D. silvatica and suggest that some IRs likely mediate olfactory signaling in chelicerates. Noticeably, we detected the expression of a gene family distantly related to insect odorant-binding proteins (OBPs), suggesting that this gene family is more ancient than previously believed, as well as the expression of an uncharacterized gene family encoding small globular secreted proteins, which appears to be a good chemosensory gene family candidate.
Keywords: arthropods; chelicerates; chemosensory gene families; de novo transcriptome assembly; functional annotation; specific RNA-Seq.
© The Author(s) 2016. Published by Oxford University Press on behalf of the Society for Molecular Biology and Evolution.
Figures
Similar articles
-
Comparative Genomics Reveals Thousands of Novel Chemosensory Genes and Massive Changes in Chemoreceptor Repertories across Chelicerates.Genome Biol Evol. 2018 Apr 1;10(5):1221-1236. doi: 10.1093/gbe/evy081. Genome Biol Evol. 2018. PMID: 29788250 Free PMC article.
-
Niemann-Pick proteins type C2 are identified as olfactory related genes of Pardosa pseudoannulata by transcriptome and expression profile analysis.Comp Biochem Physiol Part D Genomics Proteomics. 2019 Mar;29:320-329. doi: 10.1016/j.cbd.2019.01.004. Epub 2019 Jan 17. Comp Biochem Physiol Part D Genomics Proteomics. 2019. PMID: 30669056
-
Identification and preliminary characterization of chemosensory-related proteins in the gall fly, Procecidochares utilis by transcriptomic analysis.Comp Biochem Physiol Part D Genomics Proteomics. 2020 Dec;36:100724. doi: 10.1016/j.cbd.2020.100724. Epub 2020 Aug 11. Comp Biochem Physiol Part D Genomics Proteomics. 2020. PMID: 32836214
-
Engineering Aspects of Olfaction.In: Persaud KC, Marco S, Gutiérrez-Gálvez A, editors. Neuromorphic Olfaction. Boca Raton (FL): CRC Press/Taylor & Francis; 2013. Chapter 1. In: Persaud KC, Marco S, Gutiérrez-Gálvez A, editors. Neuromorphic Olfaction. Boca Raton (FL): CRC Press/Taylor & Francis; 2013. Chapter 1. PMID: 26042329 Free Books & Documents. Review.
-
Molecular evolution of the major chemosensory gene families in insects.Heredity (Edinb). 2009 Sep;103(3):208-16. doi: 10.1038/hdy.2009.55. Epub 2009 May 13. Heredity (Edinb). 2009. PMID: 19436326 Review.
Cited by
-
Diversity and Molecular Evolution of Odorant Receptor in Hemipteran Insects.Insects. 2022 Feb 21;13(2):214. doi: 10.3390/insects13020214. Insects. 2022. PMID: 35206787 Free PMC article.
-
Chemosensing of honeybee parasite, Varroa destructor: Transcriptomic analysis.Sci Rep. 2017 Oct 12;7(1):13091. doi: 10.1038/s41598-017-13167-9. Sci Rep. 2017. PMID: 29026097 Free PMC article.
-
Comprehensive History of CSP Genes: Evolution, Phylogenetic Distribution and Functions.Genes (Basel). 2020 Apr 10;11(4):413. doi: 10.3390/genes11040413. Genes (Basel). 2020. PMID: 32290210 Free PMC article. Review.
-
Evolutionary History of Chemosensory-Related Gene Families across the Arthropoda.Mol Biol Evol. 2017 Aug 1;34(8):1838-1862. doi: 10.1093/molbev/msx147. Mol Biol Evol. 2017. PMID: 28460028 Free PMC article.
-
Enormous expansion of the chemosensory gene repertoire in the omnivorous German cockroach Blattella germanica.J Exp Zool B Mol Dev Evol. 2018 Jul;330(5):265-278. doi: 10.1002/jez.b.22797. Epub 2018 Mar 22. J Exp Zool B Mol Dev Evol. 2018. PMID: 29566459 Free PMC article.
References
-
- Adams MD, et al. 2000. The genome sequence of Drosophila melanogaster . Science 287:2185–2195. - PubMed
-
- Altschul SF, Gish W, Miller W, Myers EW, Lipman DJ. 1990. Basic local alignment search tool. J Mol Biol. 215:403–410. - PubMed
-
- Benjamini Y, Hochberg Y. 1995. Controlling the false discovery rate: a practical and powerful approach to multiple testing. J R Stat Soc. 57:289–300.
Publication types
MeSH terms
Substances
LinkOut - more resources
Full Text Sources
Other Literature Sources
