. 2017 Feb 3;292(5):1899-1909.
doi: 10.1074/jbc.M116.771584. Epub 2016 Dec 23.

Regulation of ULK1 Expression and Autophagy by STAT1

Affiliations

Regulation of ULK1 Expression and Autophagy by STAT1

Alexander A Goldberg et al. J Biol Chem. .

Abstract

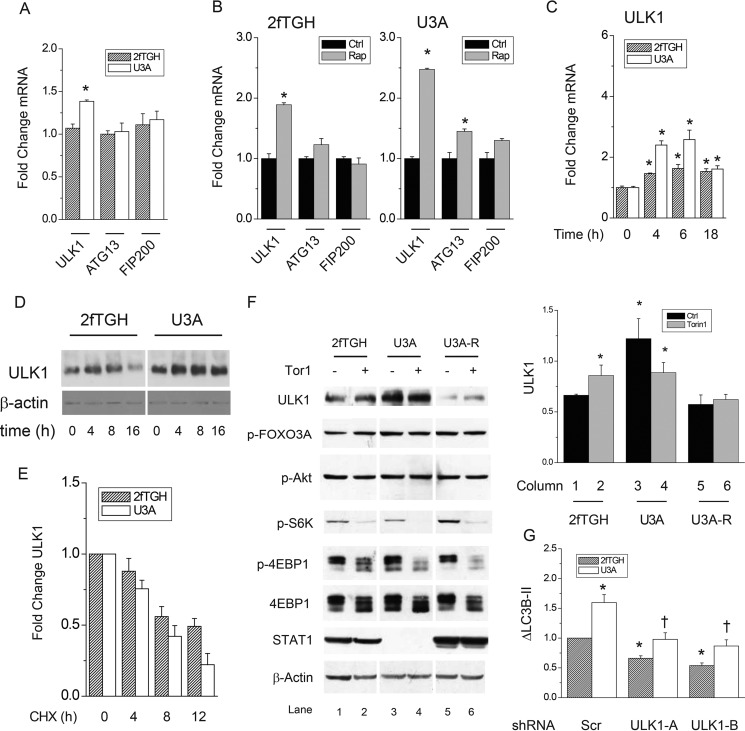
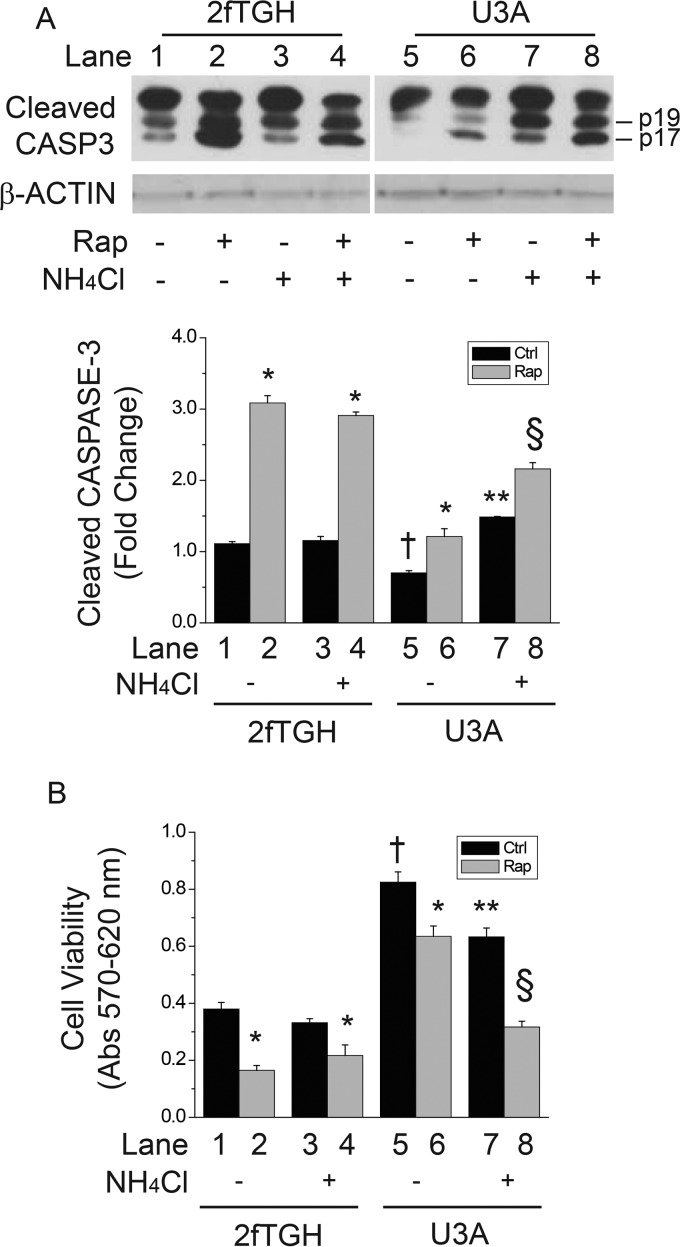
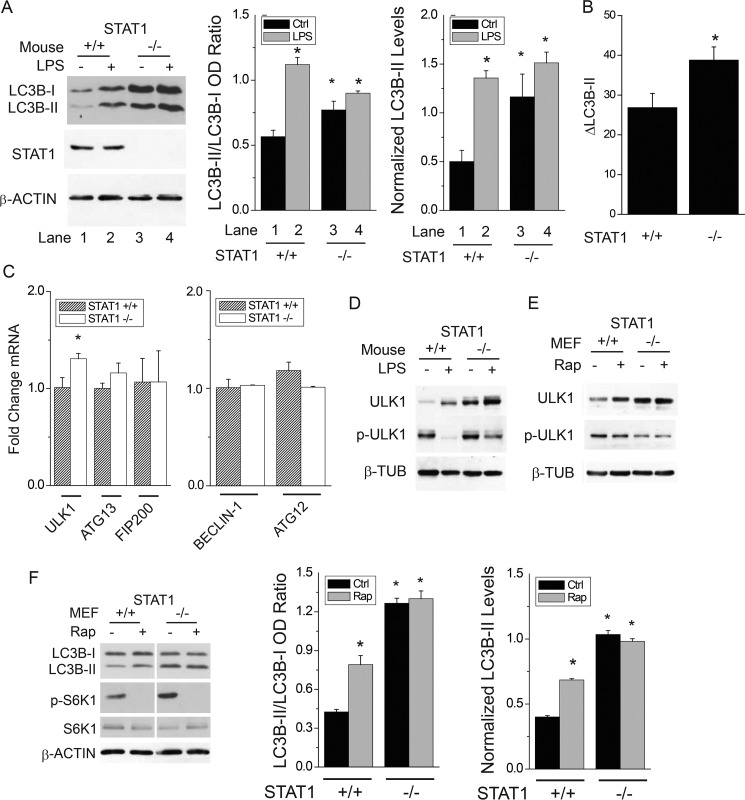
Autophagy involves the lysosomal degradation of cytoplasmic contents for regeneration of anabolic substrates during nutritional or inflammatory stress. Its initiation occurs rapidly after inactivation of the protein kinase mammalian target of rapamycin (mTOR) (or mechanistic target of rapamycin), leading to dephosphorylation of Unc-51-like kinase 1 (ULK1) and autophagosome formation. Recent studies indicate that mTOR can, in parallel, regulate the activity of stress transcription factors, including signal transducer and activator of transcription-1 (STAT1). The current study addresses the role of STAT1 as a transcriptional suppressor of autophagy genes and autophagic activity. We show that STAT1-deficient human fibrosarcoma cells exhibited enhanced autophagic flux as well as its induction by pharmacological inhibition of mTOR. Consistent with enhanced autophagy initiation, ULK1 mRNA and protein levels were increased in STAT1-deficient cells. By chromatin immunoprecipitation, STAT1 bound a putative regulatory sequence in the ULK1 5'-flanking region, the mutation of which increased ULK1 promoter activity, and rendered it unresponsive to mTOR inhibition. Consistent with an anti-apoptotic effect of autophagy, rapamycin-induced apoptosis and cytotoxicity were blocked in STAT1-deficient cells but restored in cells simultaneously exposed to the autophagy inhibitor ammonium chloride. In vivo, skeletal muscle ULK1 mRNA and protein levels as well as autophagic flux were significantly enhanced in STAT1-deficient mice. These results demonstrate a novel mechanism by which STAT1 negatively regulates ULK1 expression and autophagy.

Keywords: apoptosis; autophagy; mammalian target of rapamycin (mTOR); proteolysis; signal transducers and activators of transcription 1 (STAT1).


Conflict of interest statement

The authors declare that they have no conflicts of interest with the contents of this article

Figures

FIGURE 1.
FIGURE 1.
STAT1 is an endogenous inhibitor of autophagic flux in intact cells. Control human fibrosarcoma (2fTGH) cells, STAT1-deficient human fibrosarcoma (U3A) cells, or STAT1-deficient human fibrosarcoma cells reconstituted with STAT1 (U3A-R) were incubated with vehicle (Ctrl), rapamycin (Rap; 200 ng/ml, 218 nm), 10 mm NH4Cl, or both for 6 h after labeling with [3H]tyrosine as indicated under “Experimental Procedures.” Shown in A are the means of percent increase in free [3H]tyrosine per h (i.e. LLPD) ± S.E. from three independent experiments. The inset is a representative Western blot (composite images from the same blot) for STAT1 or β-ACTIN in 2fTGH, U3A, or U3A-R cells incubated with vehicle or rapamycin for 6 h. Shown in B. are the means of NH4Cl-sensitive LLPD (i.e. amount of LLPD blocked by NH4Cl) as calculated from the same experiments. Shown in C are the means of rapamycin-induced NH4Cl-sensitive LLPD from the same experiments. Column numbers are indicated and referenced in the “Results” section to describe comparisons made. D, 2fTGH or U3A cells were incubated without or with rapamycin for 6 h. Bafilomycin A1 (250 nm) was added 2 h before cell lysis and Western blots for LC3B, phospho-S6 S235/236 (p-S6) and β-TUBULIN. Shown the means of LC3B-II levels normalized to vehicle controls = 1 ± S.E. (E) or the means of bafilomycin-induced-fold increase in LC3B-II levels ± S.E. (ΔLC3B-II) (F), each obtained from six individual experiments. *, p < 0.05 rapamycin, NH4Cl, or bafilomycin versus vehicle control; **, p < 0.05 NH4Cl and rapamycin versus rapamycin alone; †, p < 0.05 U3A versus 2fTGH by Student's t test. G, 2fTGH or U3A cells were incubated without or with 10 nm Torin-1 for 6 h. Bafilomycin A1 (250 nm) was added 2 h before cell lysis and Western blots for LC3B, phospho-S6 Ser-235/236 (p-S6), phospho-p70 S6 kinase Thr-389 (p-S6K), phospho-Akt Ser-473 (p-Akt), STAT1, and β-ACTIN. Shown in H are the means of bafilomycin-induced increase in LC3B-II levels ± S.E. (ΔLC3B-II), each obtained from four individual experiments. *, p < 0.05 Torin-1 versus vehicle control, and U3A versus 2fTGH; †, p < 0.05 U3A versus 2fTGH treated with Torin-1.
FIGURE 2.
FIGURE 2.
STAT1 is an endogenous inhibitor of autophagy genes and ULK1 protein in human fibrosarcoma cells exposed to rapamycin and Torin-1. A, levels of mRNAs of genes encoding autophagy initiation proteins (ULK1, ATG13, FIP200) were measured in control human fibrosarcoma (2fTGH) and STAT1-deficient human fibrosarcoma (U3A) cells by real-time PCR. Shown are the means of -fold change in mRNA levels ± S.E. from three individual experiments with ULK1 mRNA levels in U3A cells = 1. *, p < 0.05 U3A versus 2fTGH by Student's t test. B, 2fTGH or U3A cells were exposed to vehicle (Ctrl) or rapamycin (Rap; 200 ng/ml, 218 nm) for 6 h before measurement of the indicated mRNA levels by real-time PCR. Shown are the means of -fold change in mRNA levels ± S.E. from three individual experiments with ULK1 mRNA levels from vehicle-treated 2fTGH (left panel) or U3A (right panel) cells = 1. Baseline ULK1 mRNA levels were 1.35-fold higher in U3A versus 2fTGH cells. *, p < 0.05 rapamycin versus vehicle control. C, 2fTGH or U3A cells were exposed to rapamycin (Rap; 200 ng/ml, 218 nm) for 0, 4, 6, or 18 h before measurement of ULK1 mRNA levels by real-time PCR. Shown are the means of -fold changes in mRNA levels ± S.E. from three individual experiments with untreated 2fTGH (gray) or untreated U3A (white) cells = 1. *, p < 0.05 rapamycin versus control (0 h). D, 2fTGH or U3A cells were exposed to rapamycin for 0, 4, 8, or 16 h before preparation of whole cell lysates and detection of ULK1 or β-ACTIN protein levels by Western blot analysis. E, 2fTGH or U3A cells were incubated with 50 μm cycloheximide (CHX) for 0, 4, 8, and 12 h before analysis of ULK1 protein levels by Western blots. F, 2fTGH or U3A cells were incubated without or with 10 nm Torin-1 for 6 h before detection of ULK1, phospho-FOXO3A S318/321 (p-FOXO3A), phospho-Akt Ser-473 (p-Akt), phospho-p70 S6 kinase Thr-389 (p-S6K), phospho-4E-BP1 Thr-37/46 (p-4EBP1), total 4E-BP1 (4E-BP1), STAT1, and β-ACTIN by Western blot. Composite images from the same blots are shown. The means of band densities for ULK1 ± S.E. from four different experiments are shown to the right. *, p < 0.05 Torin-1 versus vehicle control, by Student's t test. G, 2fTGH or U3A cells were incubated with negative control shRNA (Scr) or those targeting the ULK1 coding region (ULK1-A) or 3′-UTR (ULK1-B). The means of bafilomycin-induced increase in LC3B-II levels ± S.E. (ΔLC3B-II) were derived from three individual experiments as in Fig. 1E and H. p < 0.05 versus scrambled control in 2fTGH (*) or U3A (†) by Student's t test.
FIGURE 3.
FIGURE 3.
STAT1 binds a regulatory DNA sequence in the ULK1 promoter that confers sensitivity to mTOR inhibitors. A, shown is a diagram depicting the 5′-flanking sequence of the ULK1 gene cloned upstream of the firefly luciferase gene (black). The wild-type (WT) and mutated putative STAT1-regulatory sequence (ΔSTAT) is indicated at 126 bp upstream of the transcription start site (+1). RLU, relative luciferase units. B, after transient transfection of the WT or ΔSTAT1 ULK1 promoter constructs, control (2fTGH) or STAT1-deficient (U3A) cells were incubated with vehicle (Ctrl) or rapamycin (Rap; 200 ng/ml, 218 nm) for 6 h before cell lysis and measurement of total protein concentration and luciferase activity. Shown are the means of ULK1 promoter activity normalized to total protein levels ± S.E. from triplicate samples in three individual experiments. Column numbers are indicated and referenced in the “Results” section to describe comparisons made. *, p < 0.05 rapamycin or ΔSTAT1 versus control; †, p < 0.05 U3A versus 2fTGH by Student's t test. C, -fold enrichment of STAT1 at the ULK1 promoter region. Cells were treated with either vehicle, rapamycin (50 nm), or Torin-1 (10 nm) for 2 h. Cells were then assayed for binding of STAT1 to the ULK1 promoter +126 bp upstream of the transcription start site (+1) via chromatin immunoprecipitation (IP). Quantitative PCR was used to detect enrichment of STAT1 at the ULK1 promoter region. *, p < 0.05 IgG versus anti-STAT1.
FIGURE 4.
FIGURE 4.
Inhibition of autophagy restores apoptosis and cytotoxicity in STAT1-deficient U3A cells. 2fTGH or U3A cells were incubated with vehicle, rapamycin (Rap; 200 ng/ml, 218 nm), 10 mm NH4Cl, or both for 24 h, before detection of cleaved caspase-3 or β-ACTIN levels by Western blot analysis (A) or detection of cells viability by Crystal violet staining (B). Shown in A are composite images from the same gels for cleaved caspase-3 (Cleaved CASP3) or β-ACTIN as well as the means of integrated cleaved CASP3 band density values ± S.E. from three individual experiments. Lane numbers are indicated and referenced in the “Results” section to describe comparisons made. Data in B are the means of sample absorbance at 570 nm minus those at 620 nm ± S.E. from 3 individual experiments. *, p < 0.05 rapamycin versus vehicle control; †, U3A vehicle control versus 2fTGH vehicle control; **, p < 0.05 NH4Cl versus U3A vehicle control; §, p < 0.05 U3A cells exposed to NH4Cl and rapamycin versus those exposed to rapamycin alone.
FIGURE 5.
FIGURE 5.
STAT1 is an endogenous inhibitor of autophagy in skeletal muscles from mice exposed to bacterial lipopolysaccharide. A, wild-type (+/+) mice or those homozygous for allelic loss of STAT1 (−/−) were exposed to saline or intraperitoneal E. coli lipopolysaccharide (LPS), 5 μg/kg, and euthanized 24 h later. LC3B in diaphragm homogenates was detected by Western blot analysis and quantified by band densitometry (gel). Shown are the means of LC3B-II:LC3B-I ratio or LC3B-II normalized to β-ACTIN levels (± S.E.) from the diaphragms of four individual mice. B, wild-type (+/+) or STAT1 knock-out (−/−) mice were exposed to vehicle or colchicine (0.4 mg/kg/24 h i.p.) for 48 h before detection of LC3B-II in the diaphragm by Western blot. The mean change in LC3B-II attributed to colchicine (ΔLC3B-II, autophagic flux) ±S.E. is shown (n = 4 per group). C, mRNA levels for autophagy genes were detected from the diaphragms of mice in panel A by real-time PCR. Shown are the means of -fold-change mRNA levels versus wild-type saline-treated controls (± S.E.) for four individual mice. D, ULK1, phospho-ULK1 T757 (p-ULK1; mTORC1 phosphorylation site) or β-TUBULIN from diaphragm protein homogenates were assessed by Western blot. Gels are representative of four individual mice. E and F, STAT1 wild-type (+/+) or knock-out (−/−) MEF cells were exposed to rapamycin for 6 h before preparation of whole cell lysates and detection of ULK1, phospho-ULK1 T757 (pULK1), and β-TUBULIN (E) or LC3B, phospho-p70 S6 kinase Thr-389 (p-S6K), S6K, and β-ACTIN (F) protein levels by Western blot analysis. *, p < 0.05 versus vehicle-treated wild-type.

Similar articles

Cited by

References

    1. Mizushima N., and Komatsu M. (2011) Autophagy: renovation of cells and tissues. Cell 147, 728–741 - PubMed
    1. Yu L., McPhee C. K., Zheng L., Mardones G. A., Rong Y., Peng J., Mi N., Zhao Y., Liu Z., Wan F., Hailey D. W., Oorschot V., Klumperman J., Baehrecke E. H., and Lenardo M. J. (2010) Termination of autophagy and reformation of lysosomes regulated by mTOR. Nature 465, 942–946 - PMC - PubMed
    1. Jung C. H., Jun C. B., Ro S. H., Kim Y. M., Otto N. M., Cao J., Kundu M., and Kim D. H. (2009) ULK-Atg13-FIP200 complexes mediate mTOR signaling to the autophagy machinery. Mol. Biol. Cell 20, 1992–2003 - PMC - PubMed
    1. Chan E. Y., Longatti A., McKnight N. C., and Tooze S. A. (2009) Kinase-inactivated ULK proteins inhibit autophagy via their conserved C-terminal domains using an Atg13-independent mechanism. Mol. Cell. Biol. 29, 157–171 - PMC - PubMed
    1. Russell R. C., Tian Y., Yuan H., Park H. W., Chang Y. Y., Kim J., Kim H., Neufeld T. P., Dillin A., and Guan K. L. (2013) ULK1 induces autophagy by phosphorylating Beclin-1 and activating VPS34 lipid kinase. Nat. Cell Biol. 15, 741–750 - PMC - PubMed

Publication types

MeSH terms

LinkOut - more resources