. 2017 Jan 24;114(4):E496-E505.
doi: 10.1073/pnas.1614876114. Epub 2016 Dec 19.

Regulatory module involving FGF13, miR-504, and p53 regulates ribosomal biogenesis and supports cancer cell survival

Affiliations

Regulatory module involving FGF13, miR-504, and p53 regulates ribosomal biogenesis and supports cancer cell survival

Débora R Bublik et al. Proc Natl Acad Sci U S A. .

Abstract

The microRNA miR-504 targets TP53 mRNA encoding the p53 tumor suppressor. miR-504 resides within the fibroblast growth factor 13 (FGF13) gene, which is overexpressed in various cancers. We report that the FGF13 locus, comprising FGF13 and miR-504, is transcriptionally repressed by p53, defining an additional negative feedback loop in the p53 network. Furthermore, we show that FGF13 1A is a nucleolar protein that represses ribosomal RNA transcription and attenuates protein synthesis. Importantly, in cancer cells expressing high levels of FGF13, the depletion of FGF13 elicits increased proteostasis stress, associated with the accumulation of reactive oxygen species and apoptosis. Notably, stepwise neoplastic transformation is accompanied by a gradual increase in FGF13 expression and increased dependence on FGF13 for survival ("nononcogene addiction"). Moreover, FGF13 overexpression enables cells to cope more effectively with the stress elicited by oncogenic Ras protein. We propose that, in cells in which activated oncogenes drive excessive protein synthesis, FGF13 may favor survival by maintaining translation rates at a level compatible with the protein quality-control capacity of the cell. Thus, FGF13 may serve as an enabler, allowing cancer cells to evade proteostasis stress triggered by oncogene activation.

Keywords: FGF13; miR-504; p53; proteostasis; ribosomal biogenesis.


Conflict of interest statement

The authors declare no conflict of interest.

Figures

Fig. S1.
Fig. S1.
p53 regulates the expression of FGF13 and miR-504. (A) University of California, Santa Cruz Genome Browser snapshot showing the RefSeq FGF13 annotated transcript variants (red) with their accession numbers (blue), commonly used names (green), and naming according to the exons retained in the mature mRNA (black) (15). The black arrow indicates direction of transcription. (B) OncoPrint of FGF13 copy number alterations and mRNA expression data from a lung adenocarcinoma dataset [TCGA, cBio Portal (22)]. The majority of samples with no alterations were left out of the display. (C, Upper) qRT-PCR analysis of p53 and FGF13 mRNA (normalized to GAPDH) or miR-504 expression (normalized to SNORD44) 48 h after transient transfection of H460 cells with a single siRNA oligonucleotide targeting p53 (si53 “1”) or control (siC) siRNA. (Lower) Cell lysates from the experiment as in the upper panel were subjected to Western blot analysis with the indicated antibodies. GAPDH served as loading control. Data are expressed as means ± SD of duplicates from a representative of three independent experiments. (D) FGF13 1A mRNA expression after transient transfection of H460 cells with p53 (sip53) or control (siC) siRNA for 48 h, measured by qPCR with primers that amplify only this specific isoform. Values were normalized to GAPDH. Data are expressed as means ± SD from three independent experiments. ***P < 0.001.
Fig. 1.
Fig. 1.
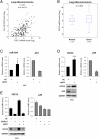
Expression of the FGF13/miR-504 unit is up-regulated in lung cancer and is negatively regulated by p53. (A) Dot plot of FGF13 mRNA and hsa-miR-504 expression levels in lung adenocarcinoma samples from TCGA. Zero miRNA expression values were ignored. Spearman correlation and P values are indicated. (B) Box plot of FGF13 mRNA in normal and tumor samples in the TCGA lung adenocarcinoma dataset. The P value was calculated using the rank-sum test. Outliers were eliminated from box plots. n = number of samples analyzed. (C, Left) qPCR analysis of miR-504 expression normalized to small nucleolar RNA, C/D box 44 (SNORD44) in H460 cells after transient transfection with p53 siRNA (sip53) or control siRNA (siC) for 48 h. (Right) qPCR analysis of p53 mRNA; values were normalized to GAPDH. Data are expressed as means ± SD from three independent experiments. *P < 0.05. (D, Upper) FGF13 and p53 mRNA expression, normalized to GAPDH, of cells treated as in C. Data are expressed as means ± SD from three independent experiments. ***P < 0.001. (Lower) Cell lysates from the same experiment were subjected to Western blot analysis with the indicated antibodies. GAPDH served as loading control. (E, Upper) FGF13 and p53 mRNA expression, normalized to GAPDH, 48 h after transient transfection of H460 cells with siRNAs targeting p53 (sip53), FGF13 (siFGF13), control siRNA (siC), or combinations thereof. Data are expressed as means ± SD of duplicates from a representative of three independent experiments. (Lower) Western blot analysis of the same experiment with antibodies against FGF13 and GAPDH (loading control).
Fig. 2.
Fig. 2.
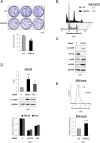
FGF13 depletion induces apoptosis and up-regulates ROS in H460 cells. (A) Representative clonogenic assay of H460 cells transfected with FGF13 siRNA (siFGF13) or control siRNA (siC) for 6 h and then seeded in triplicate at equal cell density in six-well plates. Colonies were stained with crystal violet and scanned (Upper) and were quantified (Lower) as described in SI Materials and Methods. **P < 0.01. (B) Representative image of FACS-assisted analysis of the DNA content of cells transfected with FGF13 siRNA (siFGF13) or control siRNA (siC) for 48 h. The percentage of cells with sub-G1 DNA content is indicated. (C) Western blot analysis with antibodies to the indicated proteins 48 h after transient transfection of H460 cells with FGF13 (FGF13) or control (C) siRNA. Cl. PARP, cleaved PARP. GAPDH served as loading control. (D, Top) Percentage of cells with sub-G1 DNA content based on FACS analysis of H460 cells transiently transfected for 48 h with FGF13 siRNA (FGF13), control siRNA (C), or siRNA specific for the FGF13 1A isoform (F1A). Data are expressed as fold change and represent the means ± SD from three independent experiments. ***P < 0.001, *P < 0.05 versus control siRNA. (Middle) Lysates of cells transfected as above were subjected to Western blot analysis with the indicated antibodies. (Bottom) qPCR analysis of FGF13 mRNA normalized to GAPDH to monitor FGF13 knockdown in the above experiment. qPCR was performed with primers specific for the 1A isoform (F1A) or common to all isoforms (FGF13). (E, Upper) Cells treated as in C were stained with the fluorescent dye H2DCFDA to measure ROS levels by FACS analysis. (Lower) Relative H2DCFDA fluorescence; data are expressed as the means ± SD from three independent experiments. ***P < 0.001.
Fig. S2.
Fig. S2.
Effects of FGF13 depletion in tumor cells. (A, Left) Percentage of cells with sub-G1 DNA content based on FACS analysis of H1437 cells transiently transfected for 48 h with FGF13 (siFGF13) or control (siC) siRNA. Data are expressed as fold change and represent means ± SD from three independent experiments. ***P < 0.001. (Center) Western blot analysis of lysates with antibodies to the indicated proteins. GAPDH served as loading control. (Right) qPCR analysis of FGF13 mRNA normalized to GAPDH to monitor the extent of FGF13 knockdown in the same experiment. (B) H460 cells were transfected for 48 h with FGF13 siRNA (siFGF13), control siRNA (siC), or siRNA specific for the 1A isoform (siF1A). miR-504 or FGF13 mRNA levels were measured by qPCR analysis and normalized to SNORD44 or GAPDH, respectively. (C) Representative Western blot analysis with antibodies to the indicated proteins 48 h after transient transfection of H460 cells with FGF13 (F) or control siRNA (C). Cl. PARP, cleaved PARP. z-VAD-FMK (50 μM) was added for the last 24 h. Numbers at the bottom indicate the percentage of cells with sub-G1 DNA content, measured by FACS analysis of the same experiment. (D) H460 cells transfected for 48 h with siRNAs targeting p53, FGF13, or control siRNA (C) or combinations of them were subjected to FACS-assisted DNA content analysis. Data are expressed as the percentage of cells with sub-G1 DNA content ± SD from three independent experiments; *P < 0.05; ns, not significant. (E) H460 cells were transfected with FGF13 siRNA (siFGF13) or control siRNA (siC) for 24 h and then were stained with the fluorescent dye H2DCFDA to measure ROS levels by FACS analysis. (F) Percentage of cells with sub-G1 DNA content, based on FACS analysis of H460 cells transiently transfected with FGF13 (siFGF13) or control (siC) siRNA for 48 h and treated or not treated with NAC for the last 24 h. Data are expressed as fold change of means ± SD from three independent experiments. (G) H460 cells transfected for 48 h with siRNAs targeting p53, FGF13, control siRNA (C), or combinations of them were stained with H2DCFDA, and ROS levels were determined by FACS. Data are expressed as fold change of means ± SD from two independent experiments. *P < 0.05; ns, not significant.
Fig. 3.
Fig. 3.
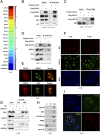
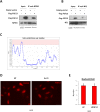
Binding partners and nucleolar localization of FGF13. (A) Heat map of the spectral counts of FGF13-interacting proteins identified by mass spectrometry in U2OS cells stably expressing Flag-FGF13 1A. SI Materials and Methods. ***P < 0.001, **P < 0.01, *P < 0.05 versus U2OS cells stably transfected with empty vector. (B) U2OS cells stably expressing Flag-FGF13 1A or empty vector were subjected to IP with anti-Flag antibodies followed by Western blot analysis with antibodies specific for Flag, B23/nucleophosmin (NPM1), NCL, or RPL11 (L11). (C) Cells were subjected to IP as in B, except that bound proteins were eluted from the anti-Flag beads with excess Flag epitope peptide and then were subjected to Western blot analysis with antibodies specific for Flag or UBF. (D) Nucleoli were isolated from U2OS cells stably expressing Flag-FGF13 1A or empty vector. Nucleolar extracts were subjected to IP with anti-Flag antibodies, followed by Western blot analysis with the indicated antibodies. (E) U2OS cells stably expressing Flag-FGF13 1A were subjected to immunofluorescence staining with anti-Flag (to visualize FGF13 1A) (Left) or anti-B23/nucleophosmin (NPM1) (Upper Center), or anti-UBF (Lower Center) antibodies. (Right) Merged images in which yellow represents regions of colocalization. (Scale bars, 5 μm.) (F) As in E, cells were either treated (+) or not treated (−) with CSK buffer (SI Materials and Methods) and were stained with antibodies against Flag or nucleolin (NCL). Nuclear DNA was stained with DAPI (blue). (Scale bars, 50 μm.) (G) H460 cells were transfected with FGF13 siRNA (siFGF13) or control siRNA (siC). Forty-eight hours later, cells were subjected to IP with an antibody against nucleolin (NCL) or anti-HA as control, followed by Western blot analysis with the indicated antibodies. RPL11 (L11), a known NCL interactor, served as positive control. GAPDH served as loading control. Short (S) and long (L) exposures of FGF13 are shown. (H) H460 cells were fractionated into cytosolic (C), nuclear (N), and nucleolar (Nu) fractions, followed by Western blot analysis with the indicated antibodies. Tubulin, lamin B, and fibrillarin served as markers for the cytosolic, nuclear, and nucleolar fractions, respectively. (I) H460 cells were extracted with CSK buffer as in F and were subjected to immunofluorescence staining with antibodies against FGF13 (green) (Upper Right) or nucleolin (NCL, red) (Lower Right) along with DAPI (blue) (Upper Left) for DNA. (Lower Left) A merged image of all three stains. (Scale bar, 50 μm.)
Fig. S3.
Fig. S3.
FGF13 1A is a nucleolar protein. (A and B) Nucleolar extracts isolated from U2OS cells stably expressing Flag-FGF13 1A or empty vector were subjected to IP with anti-NPM1 (A) or anti-NCL (B) antibodies followed by Western blot analysis of the indicated proteins. (C) Nucleolar Localization Sequence Detector (27) output graph displaying NoLS predictions for FGF13 1A. The area shown in pink represents the range of scores whereby a 20-residue segment is predicted to be an NoLS. (D) Representative image of immunofluorescence of U2OS cells stably expressing Flag-FGF13 1A either treated (Act D) or not treated (NT) with 5 nM actinomycin D for 6 h and stained with antibodies against Flag (red). (Scale bar, 20 μm.) (E) H460 cells were treated as in Fig. 4A. The number of nucleoli per cell was quantified by counting the nucleoli of 10 cells per condition. Data are expressed as means ± SD from three independent experiments.
Fig. 4.
Fig. 4.
FGF13 depletion augments nucleolar size and increases ribosomal RNA synthesis. (A and B) H460 cells were transiently transfected with FGF13 siRNA (siFGF13) or control siRNA (siC) and 24 h later were subjected to immunofluorescence staining with antibodies against the nucleolar proteins fibrillarin (FBL, red), UBF (green) (A), and B23/nucleophosmin (NPM1) (green) (B). (Scale bar, 5 μm.) (C and D) Quantification of nucleolar diameter performed on cells stained with an anti-UBF (C) or anti-NPM1 (D) antibody 24 or 48 h after transfection as in A and B (SI Materials and Methods). Data are shown as means ± SD from 15 cells per condition, from two independent experiments. ***P < 0.001. (E and F) H460 cells were transfected as in A and B, and RNA was extracted 24 (E) or 48 (F) h after transfection and subjected to qPCR analysis of 47S pre-rRNA and FGF13 mRNA, normalized to GAPDH. Data are expressed as mean ± SD from three independent experiments. **P < 0.01, *P < 0.05.
Fig. 5.
Fig. 5.
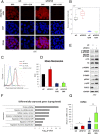
FGF13 down-regulation augments protein synthesis and induces unfolded protein stress. (A) Fluorescence microscopy imaging of protein synthesis in H460 cells transiently transfected with control siRNA (siC) or FGF13 siRNA (siFGF13) for 36 h. Fluorescence staining of nascent polypeptides was done with OPP using Alexa 568-azide (red) along with DAPI (blue) as described in SI Materials and Methods. Where indicated, CHX (100 µg/mL) was added to block protein synthesis. (Scale bar, 20 μm.) (B) Box plot quantification of Alexa Fluor 568 fluorescence intensity based on 8–10 fields containing ∼1,500 cells per condition, derived from two biological replicates. ***P < 0.001. (C) Representative FACS analysis of Alexa Fluor 568-azide fluorescence performed on cells treated as in A. (D) Quantification of FACS analysis done as in C. Data are expressed as fold change in Alexa Fluor 568 mean fluorescence intensity ± SD from two independent experiments. (E) Western blot analysis with antibodies to the indicated proteins 48 h after transient transfection of H460 cells with FGF13 siRNA (siFGF13) or control siRNA (siC). GAPDH served as loading control. (F) GO enrichment analysis of RNA-seq data performed on H460 cells transiently transfected with FGF13 or control siRNAs. GO terms belonging to biological processes were sorted by P values. (G) RNA was isolated from cells transfected as in E and treated or not with 50 µM MG132 (MG) for 4 h. HSPA6 mRNA was quantified by qPCR and normalized to GAPDH. Data are shown as the mean ± SD of three independent experiments. **P < 0.01, *P < 0.05.
Fig. S4.
Fig. S4.
Effects of FGF13 depletion on the UPR. H460 cells were transfected for 24 h with siRNAs targeting FGF13 (siFGF13) or control (siC) siRNA and were subjected to qPCR analysis of spliced XBP1 (sXBP1) and CHOP mRNA, normalized to GAPDH. Data are expressed as means ± SD from three independent experiments. **P < 0.01.
Fig. 6.
Fig. 6.
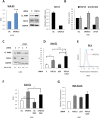
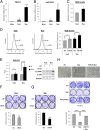
FGF13 is up-regulated in an in vitro model of cellular transformation and supports the survival of cells overexpressing oncogenic Ras. (A and B) Cells from a tissue-culture model of neoplastic transformation, comprising immortalized slow-growing WI-38 fibroblasts (WI-38Slow), their rapidly growing derivatives (WI-38Fast), and WI-38Fast cells transformed with a retrovirus encoding mutant H-Ras and selected for escape from Ras-induced antiproliferative checkpoints (WI-38Ras), were subjected to qPCR quantification of FGF13 mRNA (A) or miR-504 (B). Values were normalized to GAPDH or SNORD44, respectively *P < 0.05, **P < 0.01, ***P < 0.001. (C) WI-38Fast and WI-38Ras cells were stained with H2DCFDA, and ROS levels were determined by FACS. Fluorescence intensity is expressed as fold change. Data are shown as mean ± SD from three independent experiments. *P < 0.05. (D, Left and Center) Representative FACS images of WI-38Fast (Left) and WI-38Ras (Center) cells transiently transfected with FGF13 1A-specific siRNA (siF1A) or control siRNA (siC) for 48 h and stained for ROS as in C. (Right) Quantification of H2DCFDA fluorescence intensity expressed as fold change. Data are expressed as mean ± SD from three independent experiments. *P < 0.05; ns, not significant. (E, Left) Quantification of the relative proportion of cells with sub-G1 DNA content, deduced from FACS analysis of WI-38Fast and WI-38Ras 72 h after transfection with FGF13 1A-specific siRNA (siF1A) or control siRNA (siC). Data are expressed as fold change of FGF13 1A-specific siRNA relative to the control siRNA of each population. (Right) Western blot analysis of representative lysates probed with the indicated antibodies. GAPDH served as loading control. ***P < 0.001; ns, not significant. (F and G, Upper) Representative images of WI-38Fast (F) and WI-38Ras (G) cells transfected with FGF13 1A-specific siRNA (siF1A) or control siRNA (siC) for 6 h and subjected to clonogenic assay as in Fig. 2A. (Lower) Quantification results in upper panels. **P < 0.01. (H, Top) Representative images of WI-38Fast cells infected with empty vector retrovirus (EV) or a retrovirus expressing H-RasV12 (Ras), either alone or together with a retrovirus expressing FGF13 1A (FGF13+Ras). Hygromycin selection was initiated 2 d after infection and was continued for 8 d. Cultures were photographed 14 d after infection through a 4× phase-contrast objective. (Scale bars, 500 μm.) (Middle) Representative picture of a clonogenic assay of WI-38Fast cells infected as described above. After 8 d of drug selection cells were seeded in triplicate at an equal cell density in six-well plates and were maintained without drug for an additional 11 d. (Bottom) Colonies then were stained with crystal violet, scanned, and quantified as described in SI Materials and Methods. ***P < 0.001.
Fig. S5.
Fig. S5.
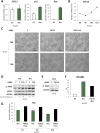
Effects of FGF13 knockdown in an in vitro model of cellular transformation. (A) qPCR analysis of FGF13, p21, and Ras mRNA in WI-38Fast cells infected with empty vector retrovirus (EV) or a retrovirus expressing H-RasV12 (Ras) and 48 h later subjected to hygromycin selection for 5 d before being harvested. Values were normalized to GAPDH mRNA. (B) WI-38Fast cells were infected as in A and 48 h later were subjected to hygromycin selection for 8 d. Cultivation was continued in the absence of drug. Cells were harvested at different days after the onset of drug selection, as indicated on the x axis, and were subjected to qPCR analysis of FGF13 mRNA. Values were normalized to GAPDH mRNA. Data are expressed as fold change relative to EV cultures cultivated in parallel under the same conditions. (C) Representative phase-contrast images of WI-38Fast and WI-38Ras cultures 72 h after transient transfection with siRNAs against FGF13, FGF13 1A, or control siRNA (C). (Scale bars, 500 μm.) (D) WI-38Fast and WI-38Ras cells were processed as in C and subjected to Western blot analysis with antibodies to the indicated proteins. GAPDH served as loading control. Short (S) and long (L) exposures of cleaved-PARP (Cl. PARP) are shown. F, FGF13 siRNA; F1A, FGF13 1A siRNA; C, control siRNA. Numbers at the bottom indicate the relative mRNA levels of FGF13 measured by qPCR with primers that recognize all isoforms or 1A specifically. siRNA C of WI-38Fast and WI-38Ras cells was set as 1. (E) WI-38Slow cells were transfected and processed as in D and were subjected to Western blot analysis with antibodies to cleaved PARP or GAPDH as loading control. (F) WI-38Fast cells were infected and processed as in Fig. 6H. Nonfixed cells then were incubated with propidium iodide (PI) and were subjected to FACS analysis. Dead cells take up propidium iodide and stain positive, whereas viable cells exclude propidium iodide. The percentage of propidium iodide-positive (dead) cells is indicated. (G) WI-38Fast cells were infected, hygromycin-selected, and cultivated as described in B. After the indicated number of days (d) from the beginning of drug selection, cultures were harvested and subjected to qPCR analysis of Ras mRNA. Values were normalized to GAPDH mRNA. Data are expressed as fold change relative to empty vector retrovirus.

Comment in

Similar articles

Cited by

References

    1. Bartel DP. MicroRNAs: Genomics, biogenesis, mechanism, and function. Cell. 2004;116(2):281–297. - PubMed
    1. Baskerville S, Bartel DP. Microarray profiling of microRNAs reveals frequent coexpression with neighboring miRNAs and host genes. RNA. 2005;11(3):241–247. - PMC - PubMed
    1. Kim Y-K, Kim VN. Processing of intronic microRNAs. EMBO J. 2007;26(3):775–783. - PMC - PubMed
    1. Hu W, et al. Negative regulation of tumor suppressor p53 by microRNA miR-504. Mol Cell. 2010;38(5):689–699. - PMC - PubMed
    1. Bieging KT, Mello SS, Attardi LD. Unravelling mechanisms of p53-mediated tumour suppression. Nat Rev Cancer. 2014;14(5):359–370. - PMC - PubMed

Publication types