Mammographic density assessed on paired raw and processed digital images and on paired screen-film and digital images across three mammography systems
- PMID: 27993168
- PMCID: PMC5168805
- DOI: 10.1186/s13058-016-0787-0
Mammographic density assessed on paired raw and processed digital images and on paired screen-film and digital images across three mammography systems
Abstract
Background: Inter-women and intra-women comparisons of mammographic density (MD) are needed in research, clinical and screening applications; however, MD measurements are influenced by mammography modality (screen film/digital) and digital image format (raw/processed). We aimed to examine differences in MD assessed on these image types.
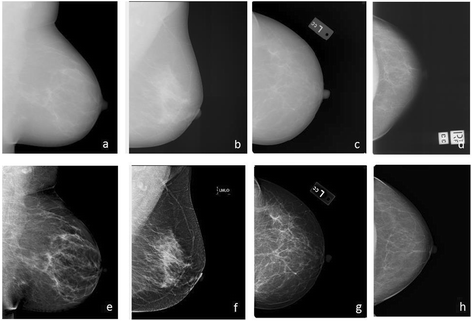
Methods: We obtained 1294 pairs of images saved in both raw and processed formats from Hologic and General Electric (GE) direct digital systems and a Fuji computed radiography (CR) system, and 128 screen-film and processed CR-digital pairs from consecutive screening rounds. Four readers performed Cumulus-based MD measurements (n = 3441), with each image pair read by the same reader. Multi-level models of square-root percent MD were fitted, with a random intercept for woman, to estimate processed-raw MD differences.
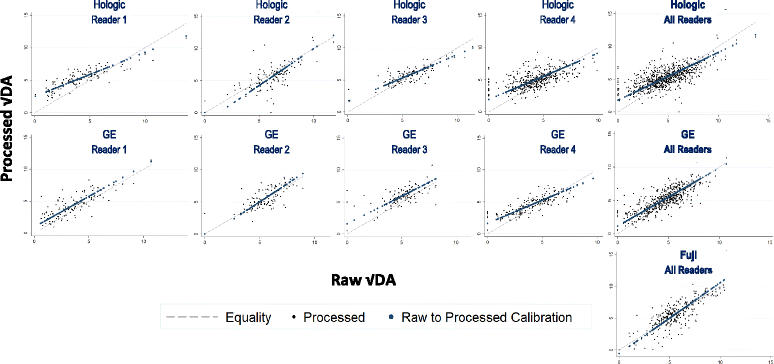
Results: Breast area did not differ in processed images compared with that in raw images, but the percent MD was higher, due to a larger dense area (median 28.5 and 25.4 cm2 respectively, mean √dense area difference 0.44 cm (95% CI: 0.36, 0.52)). This difference in √dense area was significant for direct digital systems (Hologic 0.50 cm (95% CI: 0.39, 0.61), GE 0.56 cm (95% CI: 0.42, 0.69)) but not for Fuji CR (0.06 cm (95% CI: -0.10, 0.23)). Additionally, within each system, reader-specific differences varied in magnitude and direction (p < 0.001). Conversion equations revealed differences converged to zero with increasing dense area. MD differences between screen-film and processed digital on the subsequent screening round were consistent with expected time-related MD declines.
Conclusions: MD was slightly higher when measured on processed than on raw direct digital mammograms. Comparisons of MD on these image formats should ideally control for this non-constant and reader-specific difference.
Keywords: Breast cancer; Breast density; Image processing; Mammographic density assessment; Methods.
Figures


Similar articles
-
Impact of type of full-field digital image on mammographic density assessment and breast cancer risk estimation: a case-control study.Breast Cancer Res. 2016 Sep 26;18(1):96. doi: 10.1186/s13058-016-0756-7. Breast Cancer Res. 2016. PMID: 27670914 Free PMC article.
-
Estimation of breast percent density in raw and processed full field digital mammography images via adaptive fuzzy c-means clustering and support vector machine segmentation.Med Phys. 2012 Aug;39(8):4903-17. doi: 10.1118/1.4736530. Med Phys. 2012. PMID: 22894417 Free PMC article.
-
Comparison of percent density from raw and processed full-field digital mammography data.Breast Cancer Res. 2013 Jan 4;15(1):R1. doi: 10.1186/bcr3372. Breast Cancer Res. 2013. PMID: 23289950 Free PMC article.
-
Reproductive Factors and Mammographic Density: Associations Among 24,840 Women and Comparison of Studies Using Digitized Film-Screen Mammography and Full-Field Digital Mammography.Am J Epidemiol. 2019 Jun 1;188(6):1144-1154. doi: 10.1093/aje/kwz033. Am J Epidemiol. 2019. PMID: 30865217 Free PMC article. Review.
-
Digital Breast Tomosynthesis with Hologic 3D Mammography Selenia Dimensions System for Use in Breast Cancer Screening: A Single Technology Assessment [Internet].Oslo, Norway: Knowledge Centre for the Health Services at The Norwegian Institute of Public Health (NIPH); 2017 Sep 4. Report from the Norwegian Institute of Public Health No. 2017-08. Oslo, Norway: Knowledge Centre for the Health Services at The Norwegian Institute of Public Health (NIPH); 2017 Sep 4. Report from the Norwegian Institute of Public Health No. 2017-08. PMID: 29553669 Free Books & Documents. Review.
Cited by
-
Qualitative Versus Quantitative Mammographic Breast Density Assessment: Applications for the US and Abroad.Diagnostics (Basel). 2017 May 31;7(2):30. doi: 10.3390/diagnostics7020030. Diagnostics (Basel). 2017. PMID: 28561776 Free PMC article. Review.
-
Percent mammographic density prediction: development of a model in the nurses' health studies.Cancer Causes Control. 2017 Jul;28(7):677-684. doi: 10.1007/s10552-017-0898-7. Epub 2017 May 6. Cancer Causes Control. 2017. PMID: 28478536 Free PMC article.
-
Deep learning identification of stiffness markers in breast cancer.Biomaterials. 2022 Jun;285:121540. doi: 10.1016/j.biomaterials.2022.121540. Epub 2022 Apr 27. Biomaterials. 2022. PMID: 35537336 Free PMC article.
-
Automated mammographic breast density estimation using a fully convolutional network.Med Phys. 2018 Mar;45(3):1178-1190. doi: 10.1002/mp.12763. Epub 2018 Feb 19. Med Phys. 2018. PMID: 29363774 Free PMC article.
-
Mammographic texture features associated with contralateral breast cancer in the WECARE Study.NPJ Breast Cancer. 2021 Nov 29;7(1):146. doi: 10.1038/s41523-021-00354-1. NPJ Breast Cancer. 2021. PMID: 34845211 Free PMC article.
References
-
- Warwick J, Birke H, Stone J, Warren RM, Pinney E, Brentnall AR, et al. Mammographic breast density refines Tyrer-Cuzick estimates of breast cancer risk in high-risk women: findings from the placebo arm of the International Breast Cancer Intervention Study I. Breast Cancer Res. 2014;16:451. doi: 10.1186/s13058-014-0451-5. - DOI - PMC - PubMed
Publication types
MeSH terms
Grants and funding
- C405/A14565/CRUK_/Cancer Research UK/United Kingdom
- R03 CA167771/CA/NCI NIH HHS/United States
- R01 CA177150/CA/NCI NIH HHS/United States
- P50 CA116201/CA/NCI NIH HHS/United States
- UM1 CA186107/CA/NCI NIH HHS/United States
- R01 CA131332/CA/NCI NIH HHS/United States
- UM1 CA176726/CA/NCI NIH HHS/United States
- 001/WHO_/World Health Organization/International
- 14565/CRUK_/Cancer Research UK/United Kingdom
- P01 CA087969/CA/NCI NIH HHS/United States
- R01 CA124865/CA/NCI NIH HHS/United States
- R01 CA140286/CA/NCI NIH HHS/United States
LinkOut - more resources
Full Text Sources
Other Literature Sources
Medical

