Comment
. 2016 Dec 15;167(7):1788-1802.e13.
doi: 10.1016/j.cell.2016.11.041.

Destabilization of B2 RNA by EZH2 Activates the Stress Response

Affiliations
Comment

Destabilization of B2 RNA by EZH2 Activates the Stress Response

Athanasios Zovoilis et al. Cell. .

Abstract

More than 98% of the mammalian genome is noncoding, and interspersed transposable elements account for ∼50% of noncoding space. Here, we demonstrate that a specific interaction between the polycomb protein EZH2 and RNA made from B2 SINE retrotransposons controls stress-responsive genes in mouse cells. In the heat-shock model, B2 RNA binds stress genes and suppresses their transcription. Upon stress, EZH2 is recruited and triggers cleavage of B2 RNA. B2 degradation in turn upregulates stress genes. Evidence indicates that B2 RNA operates as a "speed bump" against advancement of RNA polymerase II, and temperature stress releases the brakes on transcriptional elongation. These data attribute a new function to EZH2 that is independent of its histone methyltransferase activity and reconcile how EZH2 can be associated with both gene repression and activation. Our study reveals that EZH2 and B2 together control activation of a large network of genes involved in thermal stress.

Keywords: B2 RNA; EZH2; RNA cleavage; SINE; heat shock; polycomb; stress; transcription.


Figures

Figure 1
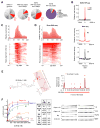
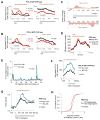
Figure 1. B2 RNA associates with EZH2 and exists as shorter species in vivo
A) B2 representation (red) among SINEs, the ES cell transcriptome (RNA-seq), and the EZH2 interactome (RIP-seq). Right pie chart depicts SINEs in the EZH2 interactome, reproduced from (Zhao et al., 2010). B) Top: Distribution of EZH2 RIP-seq reads around TSS (+/− 2000 bp) of B2 and B1 SINE elements represented as metagenes. C) Distribution of EZH2 RIP-seq reads within B2. Upper panel: Across a metagene profile of all B2 elements aligned to their TSS. Absolute distances (nt) shown on x-axis. Lower panel: Alignment of EZH2 RIP-seq reads within B2 metagene. Because of single-end 50 nt sequencing, B2 species of >50 nt would appear as 50-nt reads. D) Distribution of short RNA-seq reads within B2 (upper panel) and alignment within B2 metagene (lower panel). E) Left: Map, structure, and critical domain of B2 RNA (Espinoza et al., 2007). Right: 5′ ends of short RNA-seq reads are plotted along the B2 locus (x-axis). Red X’s (left panel) and asterisks (right panel) mark sites of discontinuity. F) Left: Binding isotherms of EZH2 from double-filter binding experiments. Middle: Table of Kd and R2 values for EZH2-B2 RNA interactions. Right: Filter binding assay for B2 RNA and EZH2. RepA I-IV and RepA I-II (positive controls), MBP and P4P6 (negative controls). Error bars within binding curves and standard deviations (SD) within the table represent three independent experiments. U, unbound; B, bound.
Figure 2
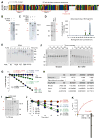
Figure 2. EZH2 triggers cleavage of B2 RNA in vitro
A) B2 sub-family consensus sequences. B) Incubation (22°C, 13h) of B2 RNA (200 nM) with EZH2 (25 nM) results in B2 cleavage. C) Incubation with 25 nM control proteins, GST and EED, does not result in significant cutting (22°C, 13h). D) Cleaved RNA fragments (asterisks) are subjected to deep sequencing (x-axis: start coordinates for the sequenced reads). E) Incubation of in vitro-transcribed RNAs (100 nM) with EZH2 (50 nM) results in cleavage only of B2. RNAs were mixed with EZH2 and incubated at 37°C or 4°C for 30 min. B2 was also incubated with FLAG peptide (50 nM) at 37°C as control. F) Kinetic analysis of B2 cleavage in the presence of EZH2. 25 nM EZH2 was incubated with 200 nM B2 RNA (37°C for 0–100 min.) and run on a 6% TBE-Urea-PAGE. G) Fraction of full-length B2 RNA at each time point from panel E (arrow) was plotted as a function of time (two independent experiments). Cleavage rate constants were then determined by a linear fit using the differential form of the rate equation for an irreversible, first-order reaction. The slope is the observed cleavage rate constant (kobs). H) Table of calculated ob kobs and RNA half-lives for B2 in the presence of various test proteins. I) Rate of B2 cleavage depends on the concentration of EZH2 protein. 50 nM B2 RNA is incubated with increasing concentrations of EZH2 in vitro (37°C, 20min) and run on a 6% TBE-Urea PAGE. J) Kinetic analysis showing that the rate of B2 cleavage depends on the concentration of EZH2 (two independent experiments). 200 nM B2 RNA is incubated with increasing EZH2 concentrations (25–500 nM) at 37°C and the amount of remaining full-length B2 RNA is plotted as a function of time. Cleavage rate constants were then determined by a linear fit using the differential form of the rate equation for an irreversible, first-order reaction. The slope approximated observed rate constant (kobs). K) kobs values from panel I are plotted as a function of EZH2 concentration. Arrowhead, full-length B2 RNA. Asterisks, cleaved B2 fragments. High R2, excellent fit of datapoints to the curve.
Figure 3
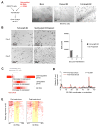
Figure 3. Heat shock destabilizes B2 RNA in vivo
A) Transfection of NIH3T3 cells with full-length B2 RNA or RNA pre-incubated with 25 nM EZH2 (37°C, 7h) and gel-purified. Mock represents transfection without any RNA. Photographed after 3 days. B) NIH/3T3 cells transfected with either synthesized full-length or truncated B2 RNA, and allowed to recover for 2–5 days. Left, photograph; right, quantitation of cells on indicated day. C) Diagram of the heat shock response and timecourse of up- and down-regulated genes. Red color represents high expression levels. D) Short RNA-seq of NIH/3T3 cells pre- and post-H/S (45 °C for 15 minutes, two biological replicates). 5′ ends of reads are mapped to the B2 transcript and their relative number is plotted on the y-axis. Data are normalized to the +1 position reads. See also Fig. S1-I for different normalization method. KS test; P<0.0001. E) Alignment of short RNA-seq reads from pre- and post-H/S cells to the B2 metagene (yellow: region of cleavage).
Figure 4
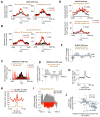
Figure 4. CHART-seq analysis of B2 RNA
A) B2 CHART-seq analysis with Probe 1 (captures uncleaved B2) or Probe 2 (captures uncleaved and cleaved B2). Probe 1 pooled probe set captures majority of B2 SNP variants. B) B2 binding peaks within indicated features of RefSeq genes. C) Pie charts showing distributions of B2 CHART peaks in comparison to general transcriptome. D) An exon/intron 1-focused metagene analysis of B2 CHART reads. KS test, P <0.0001. E) B2 binding patterns for two H/S-upregulated and two H/S-downregulated genes, along with RNA-seq data. Pre- and post-H/S profiles shown. Scale shown in brackets. F) Metagene analysis of changes in CHART-seq coverage after H/S using Probe sets 1 vs 2. G) B2 binding across TSS-centered metagene profiles +/− 1000 bp of flanking sequence. Pre- and post-H/S traces for all genes (two biological replicates, FDR<0.05 estimation of noise to input signal, E-value of 1000). H) Upper: B2 binding across TSS-centered metagene profiles +/− 1000 bp of flanking sequence. Pre- (black) and post- (red) H/S traces for upregulated genes and downregulated genes (Table S6)(two biological replicates, FDR<0.05 estimation of noise to input signal, E-value of 1000). Statistical significance (P) of the difference between pre- and post-H/S read counts determined by KS test. Lower: Corresponding relative changes in B2 binding after H/S. Relative change=ratio of post- to pre-H/S CHART reads. Positive and negative values represent increase and decrease in B2 binding, respectively.
Figure 5
Figure 5. Loss of B2 binding induces H/S-responsive genes
A) Metagene analysis of changes in POL-II-S2P binding (ChIP-seq) at H/S-upregulated and -downregulated genes (two biological replicates, FDR<0.05 estimation of noise to input signal). Statistical significance (P) determined by KS test. B) Metagene analysis of changes in POL-II-S2P binding at Type I (B2 binding in pre-H/S) and Type II (B2 binding in post-H/S) genes. Analysis performed as in (A). C) Metagene analysis of relative changes in POL-II-S2P binding after H/S for Types I and II genes. Analysis performed as in Fig. 4H. D) Metasite analysis showing distribution of PRO-seq reads (Mahat et al., 2016) around B2 binding sites (x=0) pre- and post-H/S. The shorter time frame post-H/S (2.5 min, instead of 15 min.) in the PRO-seq experiment might explain why there is incomplete release from B2 blockade. E) B2 turnover induced by B2-specific LNA shown by short RNA-sequenced after 24h. 5′ ends of short RNA-seq reads are mapped to the B2 transcript and the relative number is plotted on the y-axis (KS test, P <0.0001). Values are normalized to position +1. F) ChIP-seq analysis indicates that B2 LNA treatment recapitulates increased POL-II-S2P density across H/S-upregulated genes without application of H/S (KS test, P <0.0001). G) Metagene analysis of RNA-seq data also demonstrates that B2 LNA treatment recapitulates upregulation of H/S-responsive genes in the absence of H/S (KS test, P <0.0001). H) Cumulative frequency plot of log2 fold changes in FPKM in B2 LNA-treated cells versus Scr LNA-treated cells. Right shift for B2 target genes indicates a net positive change in gene expression after B2 cleavage without H/S. P <0.0001, KS test.
Figure 6
Figure 6. EZH2 is recruited to B2 target genes to direct H/S activation
A) Metagene analysis of changes in EZH2 binding (ChIP-seq) at H/S-upregulated and -downregulated genes. Two biological replicates (FDR<0.05 for sample signal to input noise). P<0.0001 (KS test) between pre- and post-H/S read count distribution for downregulated genes only. B) EZH2 is recruited to H/S-responsive genes with B2 sites. Metagene analysis of changes in EZH2 binding (ChIP-seq) at H/S-upregulated genes with or without B2 binding sites (Type I versus Type II). P <0.0001 (KS test) for upregulated genes with B2 binding site. C) H3K27me3 coverage is not significantly increased at TSS after EZH2 recruitment. Metagene analysis performed on subclass of H/S-upregulated Type I genes with EZH2 binding sites (either pre- or post-H/S). D) Metagene analysis showing relative changes in H3K27me3 coverage after H/S for the subclass of upregulated genes shown in (C). E) SUZ12 is not recruited to H/S-upregulated Type I genes after heat shock. Metagene analysis of changes in SUZ12 binding (ChIP-seq) at H/S-upregulated Type I genes with EZH2 binding sites. P <0.0001 (KS test). F) Metagene analysis showing relative changes in SUZ12 coverage after H/S for genes in (E). G) Meta-site analysis centered on EZH2 binding sites shows B2 binds in pre-H/S cells where EZH2 is gained after H/S. x=0 corresponds to EZH2 peak start of post-H/S cells. H) Meta-site analysis centered on B2 binding sites shows that EZH2 binds where B2 is lost during H/S. x=0 corresponds to B2 peaks of pre-H/S cells. I) Anti-correlation of B2 and EZH2 binding viewed in a metagene plot. Relative changes in either B2 or EZH2 coverage at upregulated genes are shown after H/S. J) Linear anti-correlation between B2 coverage and EZH2 density. Change in B2 density (x-axis) plotted as a function of change in EZH2 density (y-axis). R = −0.7, P< 0.05. a function of change in EZH2 density (y-axis). R = −0.7, P< 0.05.
Figure 7
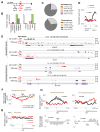
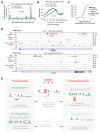
Figure 7. The Speed Bump Model
A) Depleting EZH2 for 24 hours reduces processing of B2 RNA in NIH/3T3 cells transfected with EZH2 or Scr LNAs. 5′ ends of short RNA-seq reads are mapped to the B2 transcript and the relative number of 5′ ends is plotted on the y-axis (P <0.0001, KS test) and normalized to position +1. B) EZH2 is required for the heat shock response. Metagene analysis of RNA-seq data demonstrates that EZH2 depletion reduces expression of H/S-upregulated genes (P <0.0001, KS test for pre- post-HS distributions). C) Cumulative distribution plot of log2 fold changes in FPKM in EZH2 LNA- versus Scr LNA-treated cells after H/S. Left shift for B2-EZH2 target genes indicates a net negative change in gene expression after depletion of EZH2. P <0.0001, KS test. D) Binding patterns for B2 RNA, EZH2, and POL-II-S2P at two specific genes. E) The Speed Bump Model. Upper panels, H/S-upregulated genes: In unstressed cells, B2 RNA binds target genes, serves as POL-II speed bump, and dampens gene expression. Upon stress, EZH2 is recruited and triggers B2 degradation, thereby enabling more transcriptional elongation. Bottom panels, H/S-downregulated genes bind B2 after stress induction and are reduced in expression.

Comment on

  • Easy Stress Relief by EZH2.
    Prasanth SG, Prasanth KV. Prasanth SG, et al. Cell. 2016 Dec 15;167(7):1678-1680. doi: 10.1016/j.cell.2016.11.051. Cell. 2016. PMID: 27984719

Similar articles

Cited by

References

    1. Allen TA, Von Kaenel S, Goodrich JA, Kugel JF. The SINE-encoded mouse B2 RNA represses mRNA transcription in response to heat shock. Nat Struct Mol Biol. 2004;11:816–821. - PubMed
    1. Bachvarova R. Small B2 RNAs in mouse oocytes, embryos, and somatic tissues. Developmental biology. 1988;130:513–523. - PubMed
    1. Basenko EY, Sasaki T, Ji L, Prybol CJ, Burckhardt RM, Schmitz RJ, Lewis ZA. Genome-wide redistribution of H3K27me3 is linked to genotoxic stress and defective growth. Proc Natl Acad Sci U S A. 2015;112:E6339–6348. - PMC - PubMed
    1. Bourque G, Leong B, Vega VB, Chen X, Lee YL, Srinivasan KG, Chew JL, Ruan Y, Wei CL, Ng HH, et al. Evolution of the mammalian transcription factor binding repertoire via transposable elements. Genome Res. 2008;18:1752–1762. - PMC - PubMed
    1. Brown SA, Imbalzano AN, Kingston RE. Activator-dependent regulation of transcriptional pausing on nucleosomal templates. Genes Dev. 1996;10:1479–1490. - PubMed