. 2016 Dec 27;113(52):15114-15119.
doi: 10.1073/pnas.1618737114. Epub 2016 Dec 13.

DNA methylation in the gene body influences MeCP2-mediated gene repression

Affiliations

DNA methylation in the gene body influences MeCP2-mediated gene repression

Benyam Kinde et al. Proc Natl Acad Sci U S A. .

Abstract

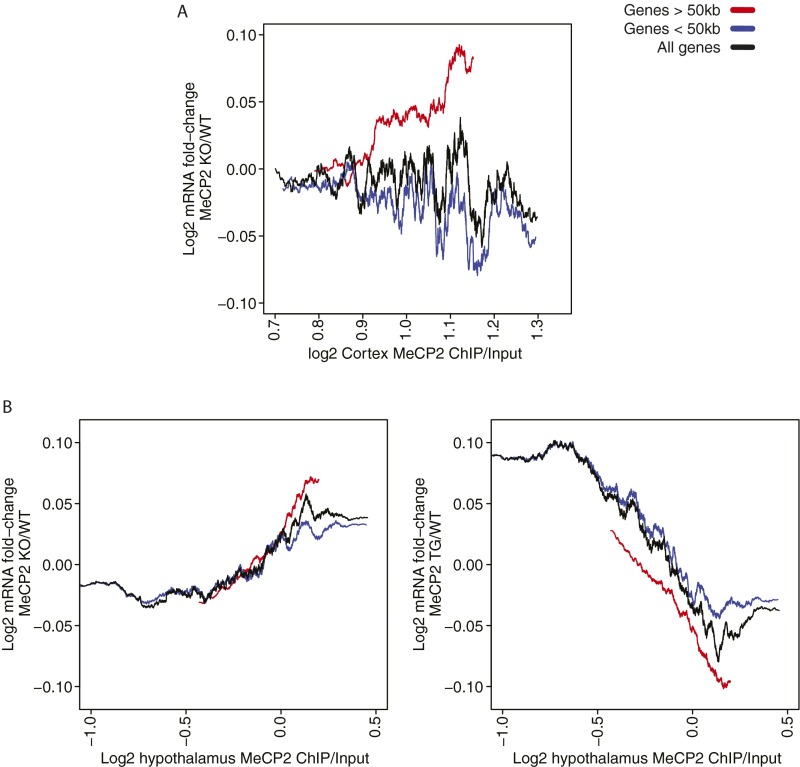
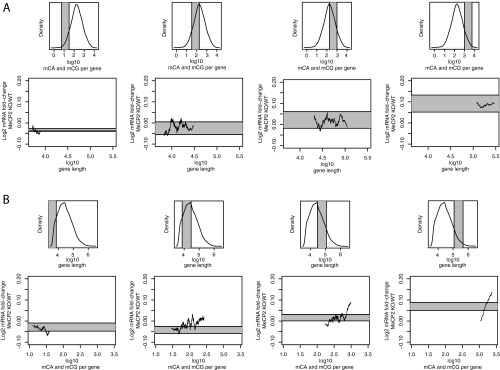
Rett syndrome is a severe neurodevelopmental disorder caused by mutations in the methyl-CpG binding protein gene (MECP2). MeCP2 is a methyl-cytosine binding protein that is proposed to function as a transcriptional repressor. However, multiple gene expression studies comparing wild-type and MeCP2-deficient neurons have failed to identify gene expression changes consistent with loss of a classical transcriptional repressor. Recent work suggests that one function of MeCP2 in neurons is to temper the expression of the longest genes in the genome by binding to methylated CA dinucleotides (mCA) within transcribed regions of these genes. Here we explore the mechanism of mCA and MeCP2 in fine tuning the expression of long genes. We find that mCA is not only highly enriched within the body of genes normally repressed by MeCP2, but also enriched within extended megabase-scale regions surrounding MeCP2-repressed genes. Whereas enrichment of mCA exists in a broad region around these genes, mCA together with mCG within gene bodies appears to be the primary driver of gene repression by MeCP2. Disruption of methylation at CA sites within the brain results in depletion of MeCP2 across genes that normally contain a high density of gene-body mCA. We further find that the degree of gene repression by MeCP2 is proportional to the total number of methylated cytosine MeCP2 binding sites across the body of a gene. These findings suggest a model in which MeCP2 tunes gene expression in neurons by binding within the transcribed regions of genes to impede the elongation of RNA polymerase.

Keywords: DNA methylation; MeCP2; Rett syndrome; transcription.


Conflict of interest statement

The authors declare no conflict of interest.

Figures

Fig. 1.
Fig. 1.
Relationship between genomic DNA methylation profiles, MeCP2 binding, and MeCP2-mediated gene regulation. (A–C) Plot of mean signal for mCA (A), mCG (B), or MeCP2 ChIP (C) density in the flanking 50 kb (Top) or 6 Mb (Middle) region around TSS and TES of MeCP2-activated genes (blue), MeCP2-repressed genes (red), and all other genes (black). To represent signal in genes of differing sizes the “metagene” region (gray) shows the average signal from +5 kb downstream of the TSS to the TES in 100 equally sized bins per gene. Boxplots (Bottom) show the distributions of levels for mCA, mCG, and MeCP2 for promoters, gene bodies, and flanking regions. Methylation density was calculated from analysis of bisulfite sequencing data in ref. . mCA/CA and mCG/CG are calculated as the number of nonconverted cytosines divided by the total number of cytosines sequenced in the CA or CG dinucleotide sequence context within 1-kb bins. MeCP2 ChIP density was calculated as the log2 fold change of MeCP2 ChIP-seq coverage relative to input coverage from the reanalysis of data in ref. . In A–C, analysis was restricted to genes >5 kb to avoid confounding affects of promoter mC depletion when analyzing the TES. Similar qualitative results were observed when including all genes. (D) Spearman correlation between mCA and mCG density in 1-kb bins in and around genes and gene misregulation in the MeCP2 KO cerebral cortex. Spearman correlation was calculated between this methylation density (8) and the log2 fold change in gene expression of MeCP2 KO vs. WT cortex (12). Data are plotted from 50 kb upstream to 75 kb downstream of the TSS and 50 kb downstream of the TES. In D, analysis was restricted to genes >75 kb to allow for inclusion of the gene body; similar results with lower correlation values are observed when analyzing all genes.
Fig. S1.
Fig. S1.
Average change in gene expression in the MeCP2 KO as a function of domain mCA density (A) or gene-body mCA density (B). To minimize the contribution of gene-body mCA in A, analysis of domain mCA was restricted to genes <7 kb. To provide a comparison with the effect seen for genes with a gene body of size similar to that of the domain size used in A, genes >100 kb were used in B. Similar results were obtained for a range of gene-length cutoffs for these analyses. In A and B, mean log2 fold change in gene expression (gene expression data from reanalysis of RNA-seq data taken from ref. 12) was calculated for genes binned according to gene-body (A) or domain (B) mCA/CA levels. Lines plotted are the running average mCA/CA levels for groups of 200 genes/domains, stepping 40 genes/domains between groups analyzed (i.e., 200 region bins, 40 gene step).
Fig. 2.
Fig. 2.
Disruption of Dnmt3a in the brain results in a mCA-associated depletion of MeCP2. MeCP2 ChIP-seq analysis of the cerebral cortex from Dnmt3a cKO (Nestin-Cre; Dnmt3a flx/flx, red) and littermate controls (Dnmt3a flx/flx, gray). The mean log2 fold change of MeCP2 ChIP coverage relative to input coverage in gene bodies was calculated for genes binned according to gene-body mCA/CA levels (200 genes per bin, 40 gene steps). Methylation data (from ref. 8) of the cerebral cortex was used for this analysis.
Fig. 3.
Fig. 3.
The total number of methylcytosines per gene, independent of gene length, is predictive of gene repression by MeCP2. (A) Mean log2 fold change in the MeCP2 KO cortex compared with WT plotted for genes according to the log10 total number of mCA and mCG sites per gene. (B) Distribution of gene-body log10 total mCA and mCG per gene (Top), with the area highlighted in gray representing the population of genes analyzed in the Bottom plot. Mean log2 fold change was plotted for genes according to gene length (Bottom) for genes that fall within the range of total mCA and mCG sites per gene indicated above. The area in gray (Bottom) indicates the maximum predicted change in gene expression that could possibly be associated with the variation in the total mCA and mCG sites per gene given the distribution of total mCA and mCG sites in the genes selected for analysis. (C) Distribution of log10 gene length (Top), with the area highlighted in gray representing the population of genes analyzed in the Bottom plot. Mean log2 fold change plotted for genes according to the log10 total number of mCA and mCG per gene (Bottom) for genes that fall within the indicated range of gene length. The area in gray (Bottom) indicates the maximum predicted change in gene expression for genes that could possibly be associated with the variation in gene length given the selected range of gene lengths indicated above. In A and the Bottom plots of B and C, mean log2 fold change in gene expression was calculated for 500 gene bins, moving one gene between each point (500 genes per bin, one gene step). Analyses were performed on bisulfite-sequencing (8) and RNA-sequencing (12) data generated in cerebral cortex tissue.
Fig. S2.
Fig. S2.
The density of MeCP2 within long genes is associated with change of gene expression upon loss of MeCP2. (A) Mean log2 fold change in mRNA expression in the MeCP2 KO cortex compared with WT plotted for genes >50 kb (red), genes <50 kb (blue), and all genes (black) according to the log2 MeCP2 ChIP/input signal detected in the gene body (+3 kb to transcription end site). (B) Mean log2 fold change in mRNA expression for the hypothalamus (19) in the MeCP2 KO (Left) and transgenic (TG) mice overexpressing MeCP2 (Right) compared with WT. Mean log2 fold change in gene expression was calculated for bins of 500 genes, stepping up one gene for each bin (i.e., 500 genes per bin, one gene step). An association between fold change in gene expression and MeCP2 ChIP signal is most robustly detected for long genes, consistent with a model in which the degree of repression exerted on a gene is proportional to the total number of MeCP2 molecules bound to the gene.
Fig. S3.
Fig. S3.
Analysis of the effects of gene length or total number of mCA and mCG per gene on MeCP2-mediated gene repression. (A) Distribution of gene-body log10 total mCA and mCG per gene (Top), with the area highlighted in gray representing the restricted population of genes analyzed in the Bottom plot. Mean log2 fold change plotted for genes according to gene length (Bottom) for genes that fall within the range of total mCA and mCG sites per gene indicated above. The area in gray (Bottom) indicates the maximum predicted change in gene expression that could possibly be associated with the variation in the total mCA and mCG sites per gene, given the distribution of total mCA and mCG sites in the genes selected for analysis. (B) Distribution of log10 gene length (Top), with the area highlighted in gray representing the population of genes analyzed in the Bottom plot. Mean log2 fold change plotted for genes according to the log10 total number of mCA and mCG per gene (Bottom) for genes that fall within the indicated range of gene length. The area in gray (Bottom) indicates the maximum predicted change in gene expression for genes that could possibly be associated with the variation in gene length, given the selected range of gene lengths indicated above (SI Experimental Procedures). Mean log2 fold change in gene expression was calculated for indicated genes according to the gene length (A) or total number of mCA and mCG sites per gene (B) for 500 gene bins, with one gene step between plotted points. Analyses were performed on bisulfite-sequencing (8) and RNA-seq (12) data generated from cerebral cortex tissue.
Fig. 4.
Fig. 4.
Analysis of mCA density for MeCP2-repressed and MeCP2-activated genes. Heatmap summary of the −log10 P value of mCA/CA (green sidebar) or mCG/CG (black sidebar) for genes identified as misregulated in MeCP2 mutant mice compared with expression-matched control genes in individual brain regions (“single” gene list) or through metaanalysis of multiple studies (“meta” gene list). Meta gene lists of MeCP2-activated and MeCP2-repressed genes were generated from reanalysis of eight microarray gene expression studies (12) (SI Experimental Procedures). Median –log10 P value was calculated (paired, one-tailed t test) for MeCP2-activated (n = 536) or MeCP2-repressed (n = 466) genes compared with 1,000 bootstrapped-resampled, expression-matched control gene lists for each respective gene list. DNA methylation data from whole genome bisulfite sequencing generated in the cortex (8), hippocampus (9), and the cerebellum (12) were analyzed.

Similar articles

Cited by

References

    1. Chahrour M, Zoghbi HY. The story of Rett syndrome: From clinic to neurobiology. Neuron. 2007;56(3):422–437. - PubMed
    1. Chen RZ, Akbarian S, Tudor M, Jaenisch R. Deficiency of methyl-CpG binding protein-2 in CNS neurons results in a Rett-like phenotype in mice. Nat Genet. 2001;27(3):327–331. - PubMed
    1. Guy J, Hendrich B, Holmes M, Martin JE, Bird A. A mouse Mecp2-null mutation causes neurological symptoms that mimic Rett syndrome. Nat Genet. 2001;27(3):322–326. - PubMed
    1. Skene PJ, et al. Neuronal MeCP2 is expressed at near histone-octamer levels and globally alters the chromatin state. Mol Cell. 2010;37(4):457–468. - PMC - PubMed
    1. Lyst MJ, et al. Rett syndrome mutations abolish the interaction of MeCP2 with the NCoR/SMRT co-repressor. Nat Neurosci. 2013;16(7):898–902. - PMC - PubMed

Publication types