. 2017 Feb;58(2):420-432.
doi: 10.1194/jlr.M073734. Epub 2016 Dec 10.

The lipid droplet-associated protein perilipin 3 facilitates hepatitis C virus-driven hepatic steatosis

Affiliations

The lipid droplet-associated protein perilipin 3 facilitates hepatitis C virus-driven hepatic steatosis

Daniel Ferguson et al. J Lipid Res. 2017 Feb.

Abstract

Hepatitis C virus (HCV) is an enveloped RNA virus responsible for 170 million cases of viral hepatitis worldwide. Over 50% of chronically infected HCV patients develop hepatic steatosis, and steatosis can be induced by expression of HCV core protein (core) alone. Additionally, core must associate with cytoplasmic lipid droplets (LDs) for steatosis development and viral particle assembly. Due to the importance of the LD as a key component of hepatic lipid storage and as a platform for HCV particle assembly, it seems this dynamic subcellular organelle is a gatekeeper in the pathogenesis of viral hepatitis. Here, we hypothesized that core requires the host LD scaffold protein, perilipin (PLIN)3, to induce hepatic steatosis. To test our hypothesis in vivo, we have studied core-induced hepatic steatosis in the absence or presence of antisense oligonucleotide-mediated knockdown of PLIN3. PLIN3 knockdown blunted HCV core-induced steatosis in transgenic mice fed either chow or a moderate fat diet. Collectively, our studies demonstrate that the LD scaffold protein, PLIN3, is essential for HCV core-induced hepatic steatosis and provide new insights into the pathogenesis of HCV.

Keywords: lipid droplets; lipoproteins/metabolism; liver; triglyceride.


Figures

Fig. 1.
Fig. 1.
Expression of core in liver induces a dose-dependent increase in liver lipid accumulation. Male mice from each line were maintained on a chow diet until 6–8 weeks of age. A: Western blot analysis of liver homogenate of each transgenic line from (B). B: Quantitative analysis of liver immunoblot. C: Enzymatic determination of TGs from liver lipid extract (n = 3–7 per group). All hepatic lipid values were normalized to tissue weight. D, E: Total body weight and liver size (expressed as a ratio to body weight) at necropsy. F: Liver sections of each line were stained with H&E for morphological analysis (20× magnification). Data shown represent mean ± SEM. Levels not connected by the same letter are significantly different.
Fig. 2.
Fig. 2.
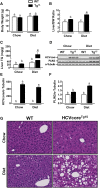
HCVcoreTg15 mice have a considerable increase in liver TGs after feeding with MFD (Diet). At 6 weeks of age, male WT or HCVcoreTg15 mice were placed on chow or MFD (20% kcal lard, 0.1% cholesterol) for a period of 6 weeks. A, B: Total body weight and liver size (expressed as a ratio to body weight) at necropsy. C: Enzymatic determination of TGs from liver lipid extract (n = 4–5 per group). D: Western blot analysis of liver homogenates from mice fed chow or MFD. E, F: Quantitative analysis of liver immunoblot for core (E) and PLIN3 (F). G: Liver sections of chow- and MFD-fed mice were stained with H&E for morphological analysis (20× magnification). Data shown represent mean ± SEM. Levels not connected by the same letter are significantly different.
Fig. 3.
Fig. 3.
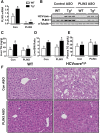
ASO-mediated knockdown of PLIN3 expression decreases steatosis in HCVcoreTg15 mice on chow and MFD. At 6 weeks of age, male WT and HCVcoreTg15 mice were treated with either control (Con) or PLIN3 ASO for 6 weeks while being maintained on either chow or MFD. A, B: Western blot (A) and quantitative analysis (B) of PLIN3 in liver homogenates from mice fed chow. C, D: Enzymatic determination of TGs from liver lipid extract (C) and liver size [expressed as a ratio to body weight (BW)] at necropsy from mice fed chow (D). E: Representative pictures of H&E staining performed on fixed liver sections (20× magnification) from mice fed chow. F, G: Western blot (F) and quantitative analysis (G) of PLIN3 in liver homogenates from mice fed MFD. H, I: Enzymatic determination of TGs from liver lipid extract (H) and liver size (expressed as a ratio to body weight) at necropsy from mice fed MFD (I). J: Representative pictures of H&E staining performed on fixed liver sections (20× magnification) from mice fed MFD. All hepatic lipid values were normalized to tissue weight. Data shown represent mean ± SEM. Levels not connected by the same letter are significantly different.
Fig. 4.
Fig. 4.
ASO-mediated knockdown of PLIN3 expression decreases steatosis in HCVcoreTg3 mice on chow diet. At 8 weeks of age, female WT and HCVcoreTg3 mice were treated with either control (Con) or PLIN3 ASO for 8 weeks while being maintained on a chow diet. A: Relative levels of liver PLIN3 mRNA were quantified by real-time PCR, normalized to levels of cyclophilin A, and expressed relative to levels in WT mice given control ASO (n = 4 per group). B: PLIN3 protein expression determined by Western blot analysis of liver homogenates. C: Enzymatic determination of TGs from liver lipid extract (n = 4–6 per group). D: Liver size (expressed as a ratio to body weight) of mice at necropsy. E: Measurement of plasma TGs determined enzymatically. F: Representative pictures of H&E staining performed on fixed liver sections (20× magnification). All hepatic lipid values were normalized to tissue weight. Data shown represent mean ± SEM from four to six mice per group. Levels not connected by the same letter are significantly different.
Fig. 5.
Fig. 5.
Knockdown of PLIN3 reduces LXR agonist-induced hepatic steatosis, but not steatosis due to fasting. A: Liver TGs were measured enzymatically from extracts made from male C57BL/6 mice fed a chow diet and treated with either a control (Con) or PLIN3 ASO for 6 weeks. During the last week of treatment, mice were also gavaged orally with either a vehicle or exogenous LXR agonist (T0901317) (n = 5 per group). B: Enzymatic determination of liver TGs from lipid extracts made from male C57BL/6 mice fed a chow diet and treated with either a control or PLIN3 ASO for 6 weeks and necropsied following an 18 h fast (n = 5 per group).
Fig. 6.
Fig. 6.
Knockdown of PLIN3 alters plasma VLDL and HDL levels. Plasma from male WT and HCVcoreTg15 mice, 6 weeks of age, treated with either control (Con) or PLIN3 ASO for 6 weeks while being maintained on a MFD (n = 4–6 per group). Levels not connected by the same letter are significantly different. A: Plasma lipoprotein profile of TGs. B: Total plasma TGs. C: Total plasma VLDL TGs. D: Total plasma LDL TGs. E: Total plasma HDL TGs F: Lipoprotein profile of plasma total cholesterol. G: Total plasma cholesterol (Total C). H: Total plasma VLDL cholesterol (VLDL-C). I: Total plasma LDL cholesterol (LDL-C). J: Total plasma HDL cholesterol (HDL-C).
Fig. 7.
Fig. 7.
Decreased core accumulation on hepatic LDs of HCVcoreTg15 mice with ASO-mediated knockdown of PLIN3. LD isolation from livers of male WT and HCVcoreTg15 mice, 6 weeks of age, treated with either control (Con) or PLIN3 ASO for 6 weeks while being maintained on a MFD (n = 3 per group). A: Western blot analysis was performed on fractions. B–E: Western blot analysis was performed on the liver LD fraction of individual animals and quantitative analysis was performed relative to the WT control group on expression of core (C), PLIN3 (D), and CGI-58 (E). F–J: Lipids were extracted from LD fractions and lipid content was determined enzymatically for TGs (F), phosphatidylcholine (PC) (G), total cholesterol (TC) (H), free cholesterol (FC) (I), and esterified cholesterol (EC) (J). Data shown represent mean ± SEM. Levels not connected by the same letter are significantly different.
Fig. 8.
Fig. 8.
HCV core-induced hepatomegaly does not involve PLIN3. At 8 weeks of age, male WT and HCVcoreTg15 mice were treated with either control (Con) or PLIN3 ASO for 8 weeks while being maintained on a MFD. A, B: Total liver weight (A) and liver size (expressed as a ratio to body weight) of mice at necropsy (B). C: Enzymatic determination of glycogen from liver extracts and normalized to tissue weight (n = 5 per group). D–F: Relative levels of liver mRNA were quantified by real-time PCR, normalized to levels of cyclophilin A, and expressed relative to levels in WT mice given control ASO (n = 5 per group). G–I: At 6 weeks of age, male WT or HCVcoreTg15 mice were placed on chow or MFD for a period of 6 weeks and relative levels of liver mRNA were quantified by real-time PCR, normalized to levels of cyclophilin A, and expressed relative to levels in WT mice given control ASO (n = 4–5 per group). Data shown represent mean ± SEM. Student’s t-test analysis was performed. *Significantly different from WT within each group (P < 0.05). #Significantly different from WT in control ASO group (P < 0.05).

Similar articles

Cited by

References

    1. Mohd Hanafiah K., Groeger J., Flaxman A. D., and Wiersma S. T.. 2013. Global epidemiology of hepatitis C virus infection: new estimates of age-specific antibody to HCV seroprevalence. Hepatology. 57: 1333–1342. - PubMed
    1. Syed G. H., Amako Y., and Siddiqui A.. 2010. Hepatitis C virus hijacks host lipid metabolism. Trends Endocrinol. Metab. 21: 33–40. - PMC - PubMed
    1. Herker E., and Ott M.. 2011. Unique ties between hepatitis C virus replication and intracellular lipids. Trends Endocrinol. Metab. 22: 241–248. - PMC - PubMed
    1. Lonardo A., Adinolfi L. E., Restivo L., Ballestri S., Romagnoli D., Baldelli E., Nascimbeni F., and Loria P.. 2014. Pathogenesis and significance of hepatitis C virus steatosis: an update on survival strategy of a successful pathogen. World J. Gastroenterol. 20: 7089–7103. - PMC - PubMed
    1. Moriya K., Yotsuyanagi H., Shintani Y., Fujie H., Ishibashi K., Matsuura Y., Miyamura T., and Koike K.. 1997. Hepatitis C virus core protein induces hepatic steatosis in transgenic mice. J. Gen. Virol. 78: 1527–1531. - PubMed

Publication types

MeSH terms