Histone deacetylase inhibitors inhibit metastasis by restoring a tumor suppressive microRNA-150 in advanced cutaneous T-cell lymphoma
- PMID: 27935859
- PMCID: PMC5352344
- DOI: 10.18632/oncotarget.13810
Histone deacetylase inhibitors inhibit metastasis by restoring a tumor suppressive microRNA-150 in advanced cutaneous T-cell lymphoma
Abstract
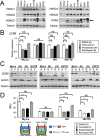
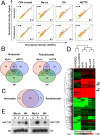
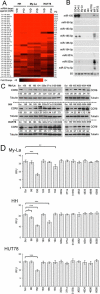
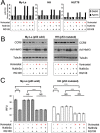
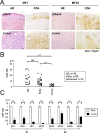
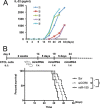
Tumor suppressive microRNA (miR)-150 inhibits metastasis by combining with the C-C chemokine receptor 6 (CCR6) "seed sequence" mRNA of the 3'-untranslated region (3'-UTR) in advanced cutaneous T-cell lymphoma (CTCL). Because the histone deacetylase inhibitor (HDACI) vorinostat showed excellent outcomes for treating advanced CTCL, HDACIs may reduce the metastasis of CTCL by targeting miR-150 and/ or CCR6. To examine whether these candidate molecules are essential HDACI targets in advanced CTCL, we used the My-La, HH, and HUT78 CTCL cell lines for functional analysis because we previously demonstrated that their xenografts in NOD/Shi-scid IL-2γnul mice (CTCL mice) induced multiple metastases. We found that pan- HDACIs (vorinostat and panobinostat) inhibited the migration of CTCL cells and downregulated CCR6. The miRNA microarray analysis against CTCL cell lines demonstrated that these pan-HDACIs commonly upregulated 161 miRNAs, including 34 known tumor suppressive miRNAs such as miR-150. Although 35 miRNAs possessing the CCR6 "seed sequence" were included in these 161 miRNAs, miR-150 and miR-185-5p were downregulated in CTCL cells compared to in normal CD4+ T-cells. The transduction of 12 candidate miRNAs against CTCL cells revealed that miR-150 most efficiently inhibited their migration capabilities and downregulated CCR6. Quantitative reverse transcriptase-polymerase chain reaction demonstrated that miR-150 was downregulated in advanced but not early CTCL primary cases. Finally, we injected miR-150 or siCCR6 into CTCL mice and found that mouse survival was significantly prolonged. These results indicate that miR-150 and its target, CCR6, are essential therapeutic targets of pan-HDACIs in advanced CTCL with metastatic potential.
Keywords: CCR6; CTCL; HDACI; metastasis; miR-150.
Conflict of interest statement
The authors declare that there are no competing financial interests.
Figures
Similar articles
-
Disruption of CCL20-CCR6 interaction inhibits metastasis of advanced cutaneous T-cell lymphoma.Oncotarget. 2016 Mar 22;7(12):13563-74. doi: 10.18632/oncotarget.6916. Oncotarget. 2016. PMID: 26789110 Free PMC article.
-
MicroRNA-150 inhibits tumor invasion and metastasis by targeting the chemokine receptor CCR6, in advanced cutaneous T-cell lymphoma.Blood. 2014 Mar 6;123(10):1499-511. doi: 10.1182/blood-2013-09-527739. Epub 2014 Jan 2. Blood. 2014. PMID: 24385540
-
MicroRNA-16 mediates the regulation of a senescence-apoptosis switch in cutaneous T-cell and other non-Hodgkin lymphomas.Oncogene. 2016 Jul 14;35(28):3692-704. doi: 10.1038/onc.2015.435. Epub 2015 Dec 7. Oncogene. 2016. PMID: 26640145
-
Vorinostat: A novel therapy for the treatment of cutaneous T-cell lymphoma.Am J Health Syst Pharm. 2010 May 15;67(10):793-7. doi: 10.2146/ajhp090247. Am J Health Syst Pharm. 2010. PMID: 20479100 Review.
-
Histone Deacetylase Inhibitors for Cutaneous T-Cell Lymphoma.Dermatol Clin. 2015 Oct;33(4):757-64. doi: 10.1016/j.det.2015.05.010. Epub 2015 Aug 29. Dermatol Clin. 2015. PMID: 26433847 Review.
Cited by
-
Histone deacetylase 6 in cancer.J Hematol Oncol. 2018 Sep 3;11(1):111. doi: 10.1186/s13045-018-0654-9. J Hematol Oncol. 2018. PMID: 30176876 Free PMC article. Review.
-
"Next top" mouse models advancing CTCL research.Front Cell Dev Biol. 2024 Apr 10;12:1372881. doi: 10.3389/fcell.2024.1372881. eCollection 2024. Front Cell Dev Biol. 2024. PMID: 38665428 Free PMC article. Review.
-
Non-Coding RNAs as Mediators of Epigenetic Changes in Malignancies.Cancers (Basel). 2020 Dec 5;12(12):3657. doi: 10.3390/cancers12123657. Cancers (Basel). 2020. PMID: 33291485 Free PMC article. Review.
-
Implication of microRNAs in Carcinogenesis with Emphasis on Hematological Malignancies and Clinical Translation.Int J Mol Sci. 2022 May 23;23(10):5838. doi: 10.3390/ijms23105838. Int J Mol Sci. 2022. PMID: 35628648 Free PMC article. Review.
-
Histone Deacetylases (HDACs) Guided Novel Therapies for T-cell lymphomas.Int J Med Sci. 2019 Jan 29;16(3):424-442. doi: 10.7150/ijms.30154. eCollection 2019. Int J Med Sci. 2019. PMID: 30911277 Free PMC article. Review.
References
-
- Willemze R, Jaffe ES, Burg G, Cerroni L, Berti E, Swerdlow SH, Ralfkiaer E, Chimenti S, Diaz-Perez JL, Duncan LM, Grange F, Harris NL, Kempf W, et al. WHO-EORTC classification for cutaneous lymphomas. Blood. 2005;105:3768–3785. - PubMed
-
- Olsen Elise, Vonderheid Eric, Pimpinelli Nicola, Willemze Rein, Kim Youn, Knobler Robert, Zackheim Herschel, Duvic Madeleine, Estrach Teresa, Lamberg Stanford, Wood Gary, Dummer Reinhard, Ranki Annamari, et al. Revisions to the staging and classification of mycosis fungoides and Sezary syndrome: a proposal of the International Society for Cutaneous Lymphomas (ISCL) and the cutaneous lymphoma task force of the European Organization of Research and Treatment of Cancer (EORTC) Blood. 2007;110:1713–1722. - PubMed
-
- Ralfkiaer E, Cerroni L, Sander CA, Smoller BR, Willemze R. Mycosis fungoides. In: Swerdlow SH, Campo E, Harris NL, Jaffe ES, Pileri SA, Stein H, Thiele J, Vardiman JW, editors. WHO Classification of Tumors of Haematopoietic and Lymphoid Tissues. Washington: IARC press, Lyon; 2008. pp. 296–298.
-
- Lewis BP, Burge CB, Bartel DP. Conserved seed pairing, often flanked by adenosines, indicates that thousands of human genes are microRNA targets. Cell. 2005;120:15–20. - PubMed
MeSH terms
Substances
LinkOut - more resources
Full Text Sources
Other Literature Sources
Medical
Research Materials

