Functional human induced hepatocytes (hiHeps) with bile acid synthesis and transport capacities: A novel in vitro cholestatic model
- PMID: 27934920
- PMCID: PMC5146671
- DOI: 10.1038/srep38694
Functional human induced hepatocytes (hiHeps) with bile acid synthesis and transport capacities: A novel in vitro cholestatic model
Abstract
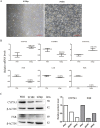
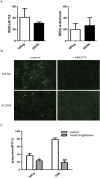
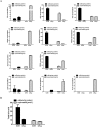
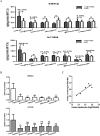
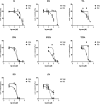
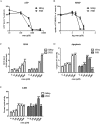
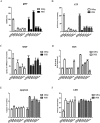
Drug-induced cholestasis is a leading cause of drug withdrawal. However, the use of primary human hepatocytes (PHHs), the gold standard for predicting cholestasis in vitro, is limited by their high cost and batch-to-batch variability. Mature hepatocyte characteristics have been observed in human induced hepatocytes (hiHeps) derived from human fibroblast transdifferentiation. Here, we evaluated whether hiHeps could biosynthesize and excrete bile acids (BAs) and their potential as PHH alternatives for cholestasis investigations. Quantitative real-time PCR (qRT-PCR) and western blotting indicated that hiHeps highly expressed BA synthases and functional transporters. Liquid chromatography tandem mass spectrometry (LC-MS/MS) showed that hiHeps produced normal intercellular unconjugated BAs but fewer conjugated BAs than human hepatocytes. When incubated with representative cholestatic agents, hiHeps exhibited sensitive drug-induced bile salt export pump (BSEP) dysfunction, and their response to cholestatic agent-mediated cytotoxicity correlated well with that of PHHs (r2 = 0.8032). Deoxycholic acid (DCA)-induced hepatotoxicity in hiHeps was verified by elevated aspartate aminotransferase (AST) and γ-glutamyl-transferase (γ-GT) levels. Mitochondrial damage and cell death suggested DCA-induced toxicity in hiHeps, which were attenuated by hepatoprotective drugs, as in PHHs. For the first time, hiHeps were reported to biosynthesize and excrete BAs, which could facilitate predicting cholestatic hepatotoxicity and screening potential therapeutic drugs against cholestasis.
Figures


Similar articles
-
Identification of Bile Acids Responsible for Inhibiting the Bile Salt Export Pump, Leading to Bile Acid Accumulation and Cell Toxicity in Rat Hepatocytes.J Pharm Sci. 2017 Sep;106(9):2412-2419. doi: 10.1016/j.xphs.2017.05.017. Epub 2017 May 26. J Pharm Sci. 2017. PMID: 28552691
-
Development of a mechanistic biokinetic model for hepatic bile acid handling to predict possible cholestatic effects of drugs.Eur J Pharm Sci. 2018 Mar 30;115:175-184. doi: 10.1016/j.ejps.2018.01.007. Epub 2018 Jan 5. Eur J Pharm Sci. 2018. PMID: 29309877
-
Hepatocyte-based in vitro model for assessment of drug-induced cholestasis.Toxicol Appl Pharmacol. 2014 Jan 1;274(1):124-36. doi: 10.1016/j.taap.2013.10.032. Epub 2013 Nov 7. Toxicol Appl Pharmacol. 2014. PMID: 24211272
-
Drug-induced perturbations of the bile acid pool, cholestasis, and hepatotoxicity: mechanistic considerations beyond the direct inhibition of the bile salt export pump.Drug Metab Dispos. 2014 Apr;42(4):566-74. doi: 10.1124/dmd.113.054205. Epub 2013 Oct 10. Drug Metab Dispos. 2014. PMID: 24115749 Review.
-
In vitro model systems to investigate bile salt export pump (BSEP) activity and drug interactions: A review.Chem Biol Interact. 2016 Aug 5;255:23-30. doi: 10.1016/j.cbi.2015.11.029. Epub 2015 Dec 10. Chem Biol Interact. 2016. PMID: 26683212 Review.
Cited by
-
In Vitro Liver Toxicity Testing of Chemicals: A Pragmatic Approach.Int J Mol Sci. 2021 May 10;22(9):5038. doi: 10.3390/ijms22095038. Int J Mol Sci. 2021. PMID: 34068678 Free PMC article. Review.
-
Optimization of Canalicular ABC Transporter Function in HuH-7 Cells by Modification of Culture Conditions.Drug Metab Dispos. 2019 Oct;47(10):1222-1230. doi: 10.1124/dmd.119.087676. Epub 2019 Aug 1. Drug Metab Dispos. 2019. PMID: 31371422 Free PMC article.
-
Stem cell-derived polarized hepatocytes.Nat Commun. 2020 Apr 3;11(1):1677. doi: 10.1038/s41467-020-15337-2. Nat Commun. 2020. PMID: 32245952 Free PMC article.
-
Alternative Cell Sources for Liver Parenchyma Repopulation: Where Do We Stand?Cells. 2020 Feb 28;9(3):566. doi: 10.3390/cells9030566. Cells. 2020. PMID: 32121068 Free PMC article. Review.
-
Direct cell reprogramming for tissue engineering and regenerative medicine.J Biol Eng. 2019 Feb 13;13:14. doi: 10.1186/s13036-019-0144-9. eCollection 2019. J Biol Eng. 2019. PMID: 30805026 Free PMC article. Review.
References
Publication types
MeSH terms
Substances
LinkOut - more resources
Full Text Sources
Other Literature Sources
Miscellaneous

