. 2017 Mar;23(3):365-377.
doi: 10.1261/rna.057612.116. Epub 2016 Dec 8.

Nup100 regulates Saccharomyces cerevisiae replicative life span by mediating the nuclear export of specific tRNAs

Affiliations

Nup100 regulates Saccharomyces cerevisiae replicative life span by mediating the nuclear export of specific tRNAs

Christopher L Lord et al. RNA. 2017 Mar.

Abstract

Nuclear pore complexes (NPCs), which are composed of nucleoporins (Nups) and regulate transport between the nucleus and cytoplasm, significantly impact the replicative life span (RLS) of Saccharomyces cerevisiae We previously reported that deletion of the nonessential gene NUP100 increases RLS, although the molecular basis for this effect was unknown. In this study, we find that nuclear tRNA accumulation contributes to increased longevity in nup100Δ cells. Fluorescence in situ hybridization (FISH) experiments demonstrate that several specific tRNAs accumulate in the nuclei of nup100Δ mutants. Protein levels of the transcription factor Gcn4 are increased when NUP100 is deleted, and GCN4 is required for the elevated life spans of nup100Δ mutants, similar to other previously described tRNA export and ribosomal mutants. Northern blots indicate that tRNA splicing and aminoacylation are not significantly affected in nup100Δ cells, suggesting that Nup100 is largely required for nuclear export of mature, processed tRNAs. Distinct tRNAs accumulate in the nuclei of nup100Δ and msn5Δ mutants, while Los1-GFP nucleocytoplasmic shuttling is unaffected by Nup100. Thus, we conclude that Nup100 regulates tRNA export in a manner distinct from Los1 or Msn5. Together, these experiments reveal a novel Nup100 role in the tRNA life cycle that impacts the S. cerevisiae life span.

Keywords: aging; nuclear pore complex; tRNA.


Figures

FIGURE 1.
FIGURE 1.
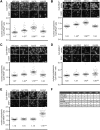
Several tRNAs accumulate in the nuclei of nup100Δ cells. (AE) (Top) Representative images of fixed cells from the indicated strains incubated with Cy5-labeled probes that hybridize tRNAile (A), tRNAtyr (B), tRNAtrp (C), tRNAser (D), or tRNAmet (E). DAPI was used to stain DNA and is shown below each Cy5 image. Scale bar, 5 µm. (Bottom) The nuclear:cytoplasmic Cy5 ratios of the cells shown above were determined as described in Materials and Methods. Each gray dot represents the ratio from one cell, and 45 cells were quantified for each strain (15 cells from three separate experiments). The large lines represent the averages for each strain, which are written below the dots, while the error bars represent the 95% CI. An asterisk indicates a P-value of less than 0.05 when the sample was compared to wild type using Tukey's post-hoc test following a one-way ANOVA, while two asterisks indicate a P-value of less than 0.05 when also compared to nup100Δ cells. (F) Table summarizing nuclear export defects for the listed tRNAs and strains. The lack of any clear defect is indicated using “−”, moderate defects are shown with a single “+”, while strong defects are shown with two “+” symbols.
FIGURE 2.
FIGURE 2.
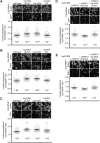
tRNAs are enriched in the nuclei of cells specifically lacking the GLFG domain of Nup100. (AC) (Top) Representative images of fixed cells from the listed W303 strains incubated with Cy5-labeled probes that hybridize tRNAile (A), tRNAtrp (B), or tRNAtyr (C). DAPI was used to stain DNA and is shown below each Cy5 image. Scale bar, 5 µm. (Bottom) Nuclear:cytoplasmic Cy5 ratios of the cells shown above were determined; each gray dot represents the ratio from one cell, and 60 cells were quantified for each strain (20 cells from three separate experiments). Large lines represent the averages for each strain, while error bars represent the 95% CI. Averages are listed below dots. An asterisk indicates a P-value of less than 0.05 when compared to wild type using Tukey's post-hoc test following a one-way ANOVA. (D,E) (Top) Representative images of S288C nup100Δ cells transformed with pRS313, pRS313-NUP100, or pRS313-nup100ΔGLFG and incubated with Cy5-labeled probes that hybridize tRNAtyr (D) or tRNAtrp (E). DAPI was used to stain DNA and is shown below each Cy5 image. Scale bar, 5 µm. (Bottom) Nuclear:cytoplasmic ratios for cells shown above were calculated; an asterisk indicates a P-value of less than 0.05 when compared to nup100Δ cells transformed with pRS313 using Tukey's post-hoc test following a one-way ANOVA with at least 30 cells.
FIGURE 3.
FIGURE 3.
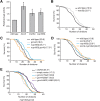
Gcn4 is activated in nup100Δ mutants and required for their increased longevity. (A) Relative levels of β-gal activity from the lysates of strains transformed with GCN4-lacZ (p180) (Hinnebusch 1985). An asterisk indicates a P-value of less than 0.05 when compared to wild type using a two-tailed Student's t-test with an n of at least six. (BD) Survival curves for the indicated strains; average life spans for each are listed in parentheses next to the strain name. An asterisk indicates a P-value of less than 0.05 when the values were compared to wild type using a two-tailed Mann–Whitney U-test with an n of at least 60 cells per strain. (E) Survival curves for nup100Δ gcn4Δ cells transformed with the listed integrating vectors. An asterisk indicates a P-value of less than 0.05 when the values were compared to the strain transformed with the empty vector using a two-tailed Mann–Whitney U-test with an n of at least 45 cells per strain.
FIGURE 4.
FIGURE 4.
Transcriptional memory factors do not affect life span. (A) Survival curves of wild-type, set1Δ, and set3Δ strains; average life spans are listed in parentheses next to strain names. An asterisk indicates a P-value of less than 0.05 when compared to wild type using a Mann–Whitney U-test with an n of at least 50 cells per strain. (B) β-Gal activity of lysates from the listed strains transformed with p180; an asterisk indicates a P-value of less than 0.05 when compared to wild type using a two-tailed Student's t-test.
FIGURE 5.
FIGURE 5.
Spliced tRNAs largely accumulate in nup100Δ mutants. (A,B) (Top) Northern blots of total RNAs from the listed strains. Membranes were incubated with a radiolabeled probe that hybridizes with tRNAile (A) or tRNAtyr (B); mature, intron-containing, and primary tRNA transcripts were detected and the locations of each are listed on the side of the image. (Bottom) RNAs were also stained with ethidium bromide to visualize total tRNA as well as 5S and 5.8S RNA. (C) RNAs isolated under acidic conditions from the listed strains were resuspended in 10 mM sodium acetate pH 4.5 (lanes 13) or 100 mM Tris pH 9.0 (lanes 46), and Northern blots were performed with a radiolabeled probe that hybridizes tRNAtyr. (D,E) The relative amounts of intron-containing:mature tRNAile (D) or tRNAtyr (E) were quantified from the listed strains from three different experiments. Error bars represent SEM, and an asterisk indicates a P-value of less than 0.05 when compared to wild-type RNA, while two asterisks indicate an additional P-value of less than 0.05 when compared to nup100Δ RNA.
FIGURE 6.
FIGURE 6.
Nup100 regulates tRNA export without affecting Los1 or Msn5 transport. (A) Los1- or Msn5-GFP were visualized in live wild-type or nup100Δ cells. DIC images of cells are shown above GFP images. Scale bar, 4 µm. (B) The localizations of Tef1- or Tef2-GFP were determined in wild-type or nup100Δ cells. Scale bar, 4 µm. (C) Graph of Los1-GFP nuclear and rim fluorescence loss from cells with cytoplasms that were continuously bleached every ∼3 sec, determined as described in Materials and Methods. At least 30 cells per strain were used for this analysis. The values at each time point were averaged, and a best-fit one-phase decay curve was produced and is shown on the graph. Error bars represent 95% CI. (D) Individual half-times for nuclear and rim Los1-GFP fluorescence loss with at least 30 cells (gray dots) per strain. Large lines represent the averages for each strain, while error bars represent the 95% CI. The P-value when comparing the two sets of data was 0.3268 using a two-tailed Student's t-test. (E) Representative Los1-GFP (top) and nup100Δ Los1-GFP (bottom) cells used to generate data in C and D, with cytoplasms that were bleached following the initial scan every ∼3 sec. Arrows point to the cells that were bleached, while the white box shows where cells were continuously bleached. Scale bar, 5 µm.
FIGURE 7.
FIGURE 7.
Model for how Nup100 potentially regulates S. cerevisiae replicative life span through its effect on tRNA export. (A) Nup100 is required for the re-export of specific tRNAs, including tRNAtyr, tRNAile, and tRNAtrp, following their splicing and aminoacylation. (B) Several tRNAs (gray) accumulate in the nuclei of nup100Δ cells. This tRNA export defect causes overproduction Gcn4, which may promote increased life span. Nuclear tRNA accumulation in other mutants, including los1Δ and msn5Δ cells, produces similar effects on Gcn4 protein levels and RLS.

Similar articles

Cited by

References

    1. Adams RL, Terry LJ, Wente SR. 2014. Nucleoporin FG domains facilitate mRNP remodeling at the cytoplasmic face of the nuclear pore complex. Genetics 197: 1213–1224. - PMC - PubMed
    1. Ahmed S, Brickner DG, Light WH, Cajigas I, McDonough M, Froyshteter AB, Volpe T, Brickner JH. 2010. DNA zip codes control an ancient mechanism for gene targeting to the nuclear periphery. Nat Cell Biol 12: 111–118. - PMC - PubMed
    1. Chernyakov I, Baker MA, Grayhack EJ, Phizicky EM. 2008. Identification and analysis of tRNAs that are degraded in Saccharomyces cerevisiae due to lack of modifications. In Methods in enzymology (ed. Maquat LE, Kiledjian M), Vol. 449, pp. 221–237. Academic Press, NY. - PMC - PubMed
    1. Chu H-Y, Hopper AK. 2013. Genome-wide investigation of the role of the tRNA nuclear-cytoplasmic trafficking pathway in regulation of the yeast Saccharomyces cerevisiae transcriptome and proteome. Mol Cell Biol 33: 4241–4254. - PMC - PubMed
    1. Dever TE. 1997. Using GCN4 as a reporter of eIF2α phosphorylation and translational regulation in yeast. Methods 11: 403–417. - PubMed

MeSH terms

LinkOut - more resources