

Bias Due to Correlation Between Times-at-Risk for Infection in Epidemiologic Studies Measuring Biological Interactions Between Sexually Transmitted Infections: A Case Study Using Human Papillomavirus Type Interactions
- PMID: 27927619
- PMCID: PMC5161088
- DOI: 10.1093/aje/kww152
Bias Due to Correlation Between Times-at-Risk for Infection in Epidemiologic Studies Measuring Biological Interactions Between Sexually Transmitted Infections: A Case Study Using Human Papillomavirus Type Interactions
Abstract
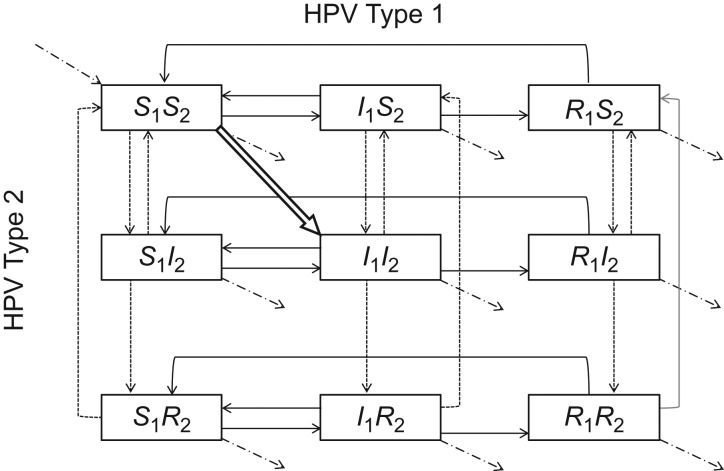
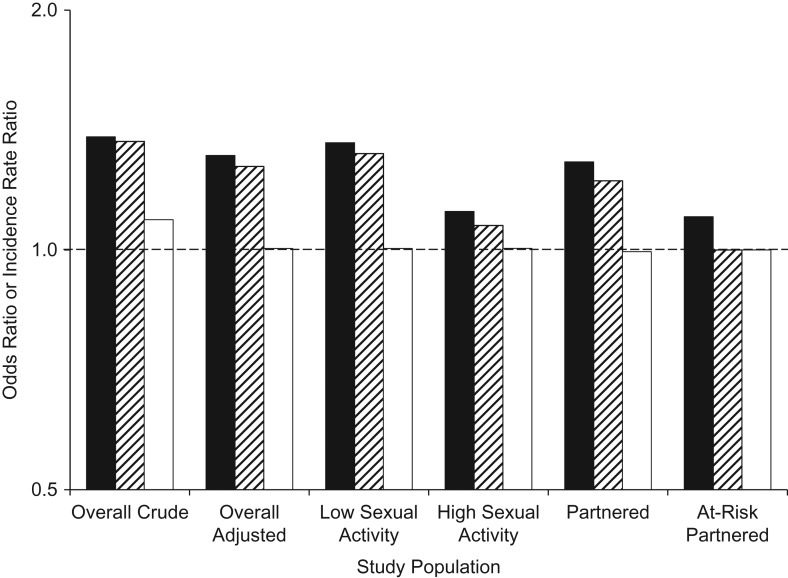
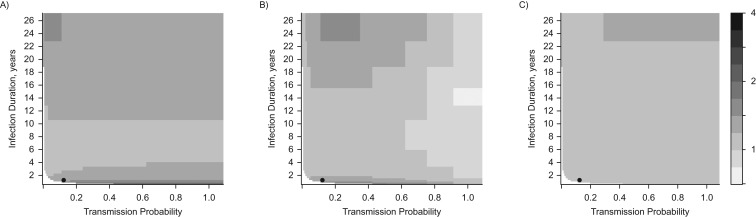
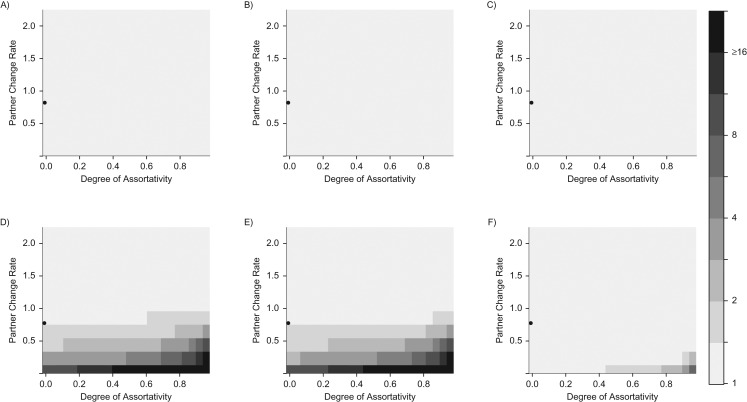
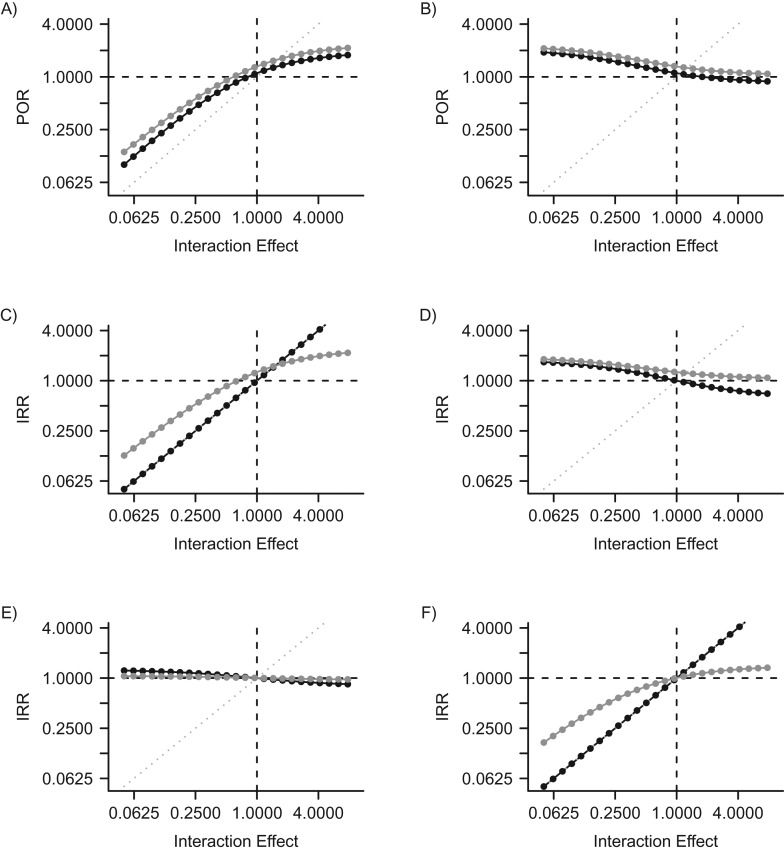
The clustering of human papillomavirus (HPV) infections in some individuals is often interpreted as the result of common risk factors rather than biological interactions between different types of HPV. The intraindividual correlation between times-at-risk for all HPV infections is not generally considered in the analysis of epidemiologic studies. We used a deterministic transmission model to simulate cross-sectional and prospective epidemiologic studies measuring associations between 2 HPV types. When we assumed no interactions, the model predicted that studies would estimate odds ratios and incidence rate ratios greater than 1 between HPV types even after complete adjustment for sexual behavior. We demonstrated that this residual association is due to correlation between the times-at-risk for different HPV types, where individuals become concurrently at risk for all of their partners' HPV types when they enter a partnership and are not at risk when they are single. This correlation can be controlled in prospective studies by restricting analyses to susceptible individuals with an infected sexual partner. The bias in the measured associations was largest in low-sexual-activity populations, cross-sectional studies, and studies which evaluated infection with a first HPV type as the exposure. These results suggest that current epidemiologic evidence does not preclude the existence of competitive biological interactions between HPV types.
Keywords: bias (epidemiology); coinfection; cross-protection; microbial interactions; papillomavirus infections; sexually transmitted diseases; time factors; viral interference.
© The Author 2016. Published by Oxford University Press on behalf of the Johns Hopkins Bloomberg School of Public Health. All rights reserved. For permissions, please e-mail: journals.permissions@oup.com.
Figures
Similar articles
-
Determinants of low-risk and high-risk cervical human papillomavirus infections in Montreal University students.Sex Transm Dis. 2000 Feb;27(2):79-86. doi: 10.1097/00007435-200002000-00005. Sex Transm Dis. 2000. PMID: 10676974
-
Type-specific human papillomavirus infections among young heterosexual male and female STI clinic attendees.Sex Transm Dis. 2012 Jan;39(1):72-8. doi: 10.1097/OLQ.0b013e318235b3b0. Sex Transm Dis. 2012. PMID: 22183851
-
Factors affecting transmission of mucosal human papillomavirus.Lancet Infect Dis. 2010 Dec;10(12):862-74. doi: 10.1016/S1473-3099(10)70190-0. Epub 2010 Nov 11. Lancet Infect Dis. 2010. PMID: 21075056 Review.
-
HPV in female partners increases risk of incident HPV infection acquisition in heterosexual men in rural central Mexico.Cancer Epidemiol Biomarkers Prev. 2012 Nov;21(11):1956-65. doi: 10.1158/1055-9965.EPI-12-0470. Epub 2012 Aug 22. Cancer Epidemiol Biomarkers Prev. 2012. PMID: 22914530
-
Chapter 6: Epidemiology and transmission dynamics of genital HPV infection.Vaccine. 2006 Aug 31;24 Suppl 3:S3/52-61. doi: 10.1016/j.vaccine.2006.05.031. Epub 2006 Jun 2. Vaccine. 2006. PMID: 16950018 Review.
Cited by
-
Detecting within-host interactions from genotype combination prevalence data.Epidemics. 2019 Dec;29:100349. doi: 10.1016/j.epidem.2019.100349. Epub 2019 Jun 18. Epidemics. 2019. PMID: 31257014 Free PMC article.
-
Evidence of synergistic relationships between HIV and Human Papillomavirus (HPV): systematic reviews and meta-analyses of longitudinal studies of HPV acquisition and clearance by HIV status, and of HIV acquisition by HPV status.J Int AIDS Soc. 2018 Jun;21(6):e25110. doi: 10.1002/jia2.25110. J Int AIDS Soc. 2018. PMID: 29873885 Free PMC article.
-
Global and regional estimates of the contribution of herpes simplex virus type 2 infection to HIV incidence: a population attributable fraction analysis using published epidemiological data.Lancet Infect Dis. 2020 Feb;20(2):240-249. doi: 10.1016/S1473-3099(19)30470-0. Epub 2019 Nov 18. Lancet Infect Dis. 2020. PMID: 31753763 Free PMC article.
-
Recurring infection with ecologically distinct HPV types can explain high prevalence and diversity.Proc Natl Acad Sci U S A. 2017 Dec 19;114(51):13573-13578. doi: 10.1073/pnas.1714712114. Epub 2017 Dec 5. Proc Natl Acad Sci U S A. 2017. PMID: 29208707 Free PMC article.
-
Effect of HSV-2 infection on subsequent HIV acquisition: an updated systematic review and meta-analysis.Lancet Infect Dis. 2017 Dec;17(12):1303-1316. doi: 10.1016/S1473-3099(17)30405-X. Epub 2017 Aug 23. Lancet Infect Dis. 2017. PMID: 28843576 Free PMC article. Review.
References
-
- Plummer M, Vaccarella S, Franceschi S. Multiple human papillomavirus infections: the exception or the rule. J Infect Dis. 2011;203(7):891–893. - PubMed
Publication types
MeSH terms
Grants and funding
LinkOut - more resources
Full Text Sources
Other Literature Sources
