

RCANs regulate the convergent roles of NFATc1 in bone homeostasis
- PMID: 27917924
- PMCID: PMC5137032
- DOI: 10.1038/srep38526
RCANs regulate the convergent roles of NFATc1 in bone homeostasis
Abstract
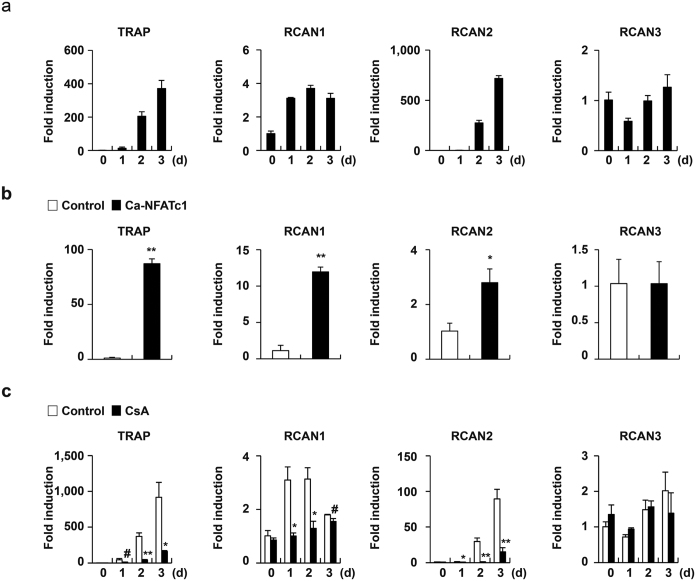
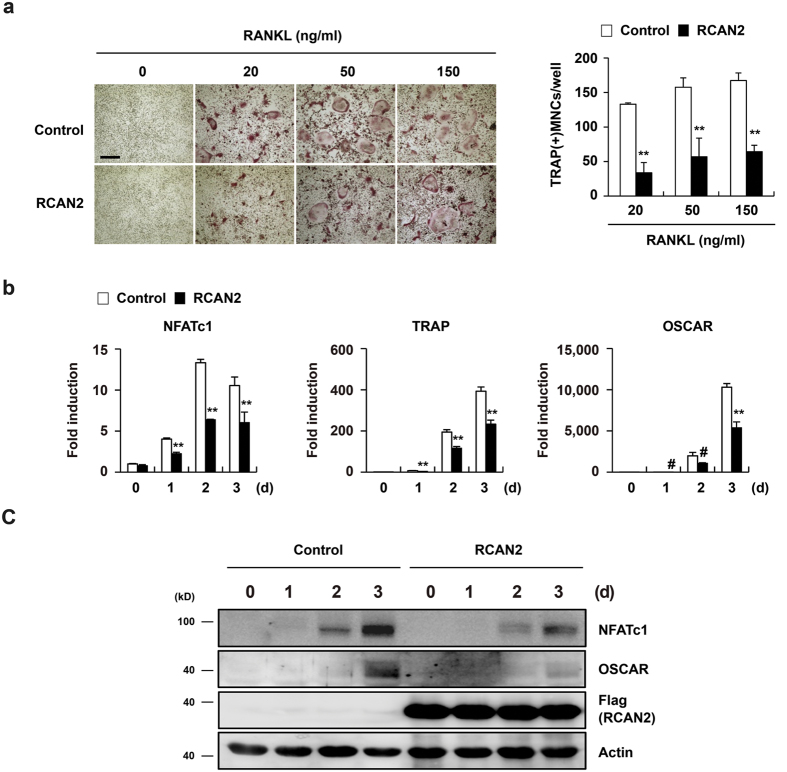
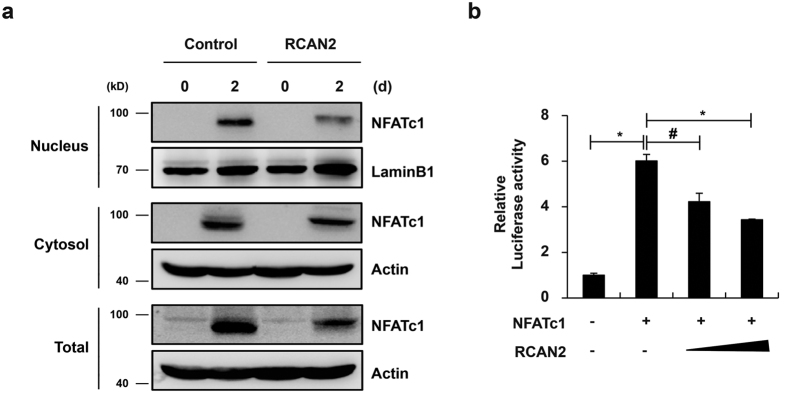
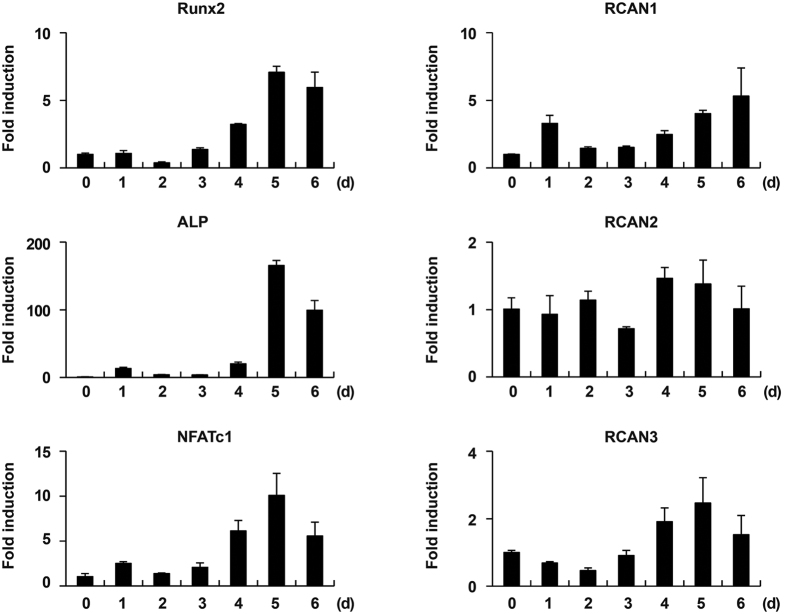
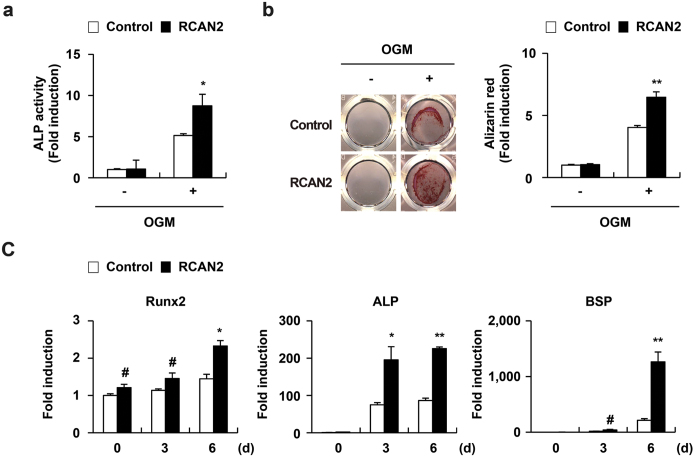
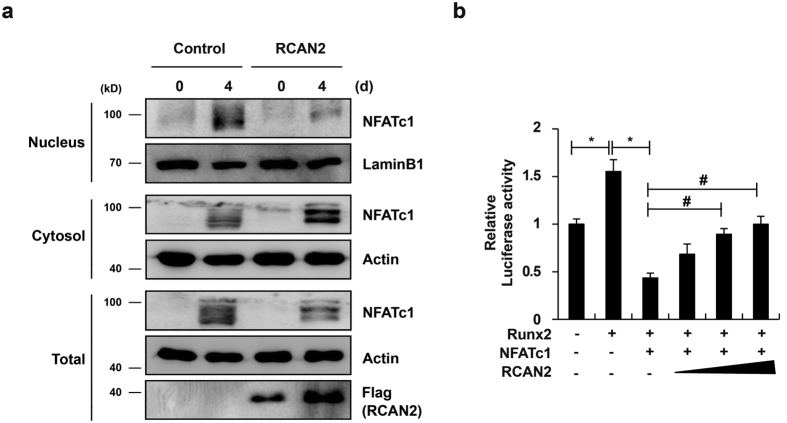
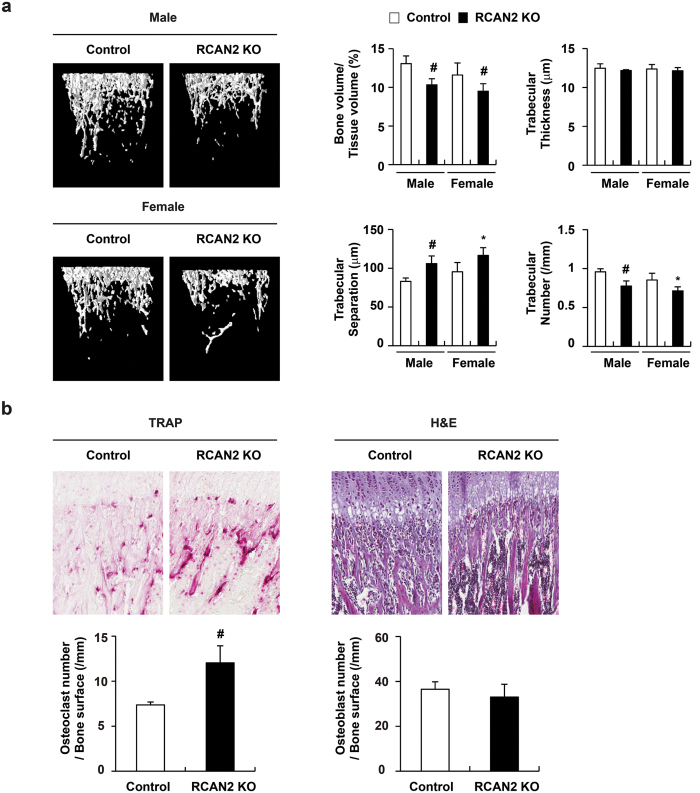
Activation of calcineurin-dependent nuclear factor of activated T cells c1 (NFATc1) is convergent for normal bone homeostasis. NFATc1 regulates both osteoclastogenesis and osteoblastogenesis. Here we investigated the roles of regulator of calcineurin (RCAN) genes in bone homeostasis. RCANs function as potent physiological inhibitors of calcineurin. Overexpression of RCANs in osteoclast precursor cells attenuated osteoclast differentiation, while their overexpression in osteoblasts enhanced osteoblast differentiation and function. Intriguingly, opposing effects of RCANs in both cell types were shown by blocking activation of the calcineurin-NFATc1 pathway. Moreover, the disruption of RCAN1 or RCAN2 in mice resulted in reduced bone mass, which is associated with strongly increased osteoclast function and mildly reduced osteoblast function. Taken together, RCANs play critical roles in bone homeostasis by regulating both osteoclastogenesis and osteoblastogenesis, and they serve as inhibitors for calcineurin-NFATc1 signaling both in vivo and in vitro.
Figures
Similar articles
-
Homer2 and Homer3 modulate RANKL-induced NFATc1 signaling in osteoclastogenesis and bone metabolism.J Endocrinol. 2019 Sep;242(3):241-249. doi: 10.1530/JOE-19-0123. J Endocrinol. 2019. PMID: 31319381 Free PMC article.
-
RGS18 acts as a negative regulator of osteoclastogenesis by modulating the acid-sensing OGR1/NFAT signaling pathway.J Bone Miner Res. 2007 Oct;22(10):1612-20. doi: 10.1359/jbmr.070612. J Bone Miner Res. 2007. PMID: 17576169
-
Caffeic acid 3,4-dihydroxy-phenethyl ester suppresses receptor activator of NF-κB ligand–induced osteoclastogenesis and prevents ovariectomy-induced bone loss through inhibition of mitogen-activated protein kinase/activator protein 1 and Ca2+–nuclear factor of activated T-cells cytoplasmic 1 signaling pathways.J Bone Miner Res. 2012 Jun;27(6):1298-1308. doi: 10.1002/jbmr.1576. J Bone Miner Res. 2012. PMID: 22337253
-
Toxic Effects of Indoxyl Sulfate on Osteoclastogenesis and Osteoblastogenesis.Int J Mol Sci. 2021 Oct 19;22(20):11265. doi: 10.3390/ijms222011265. Int J Mol Sci. 2021. PMID: 34681927 Free PMC article. Review.
-
The Role of Ca2+-NFATc1 Signaling and Its Modulation on Osteoclastogenesis.Int J Mol Sci. 2020 May 21;21(10):3646. doi: 10.3390/ijms21103646. Int J Mol Sci. 2020. PMID: 32455661 Free PMC article. Review.
Cited by
-
The loss of STAT3 in mature osteoclasts has detrimental effects on bone structure.PLoS One. 2020 Jul 30;15(7):e0236891. doi: 10.1371/journal.pone.0236891. eCollection 2020. PLoS One. 2020. PMID: 32730332 Free PMC article.
-
USP7-mediated JUND suppresses RCAN2 transcription and elevates NFATC1 to enhance stem cell property in colorectal cancer.Cell Biol Toxicol. 2023 Dec;39(6):3121-3140. doi: 10.1007/s10565-023-09822-9. Epub 2023 Aug 3. Cell Biol Toxicol. 2023. PMID: 37535148
-
C-phycocyanin attenuates RANKL-induced osteoclastogenesis and bone resorption in vitro through inhibiting ROS levels, NFATc1 and NF-κB activation.Sci Rep. 2020 Feb 13;10(1):2513. doi: 10.1038/s41598-020-59363-y. Sci Rep. 2020. PMID: 32054921 Free PMC article.
-
Up-regulation of RNA Binding Proteins Contributes to Folate Deficiency-Induced Neural Crest Cells Dysfunction.Int J Biol Sci. 2020 Jan 1;16(1):85-98. doi: 10.7150/ijbs.33976. eCollection 2020. Int J Biol Sci. 2020. PMID: 31892848 Free PMC article.
-
Essentiality of Nfatc1 short isoform in osteoclast differentiation and its self-regulation.Sci Rep. 2023 Nov 1;13(1):18797. doi: 10.1038/s41598-023-45909-3. Sci Rep. 2023. PMID: 37914750 Free PMC article.
References
-
- Hofbauer L. C. et al.. Stimulation of osteoprotegerin ligand and inhibition of osteoprotegerin production by glucocorticoids in human osteoblastic lineage cells: potential paracrine mechanisms of glucocorticoid-induced osteoporosis. Endocrinology 140, 4382–4389, doi: 10.1210/endo.140.10.7034 (1999). - DOI - PubMed
Publication types
MeSH terms
Substances
LinkOut - more resources
Full Text Sources
Other Literature Sources
Miscellaneous
