

Patterns of Cortical and Subcortical Amyloid Burden across Stages of Preclinical Alzheimer's Disease
- PMID: 27903335
- PMCID: PMC5240733
- DOI: 10.1017/S1355617716000928
Patterns of Cortical and Subcortical Amyloid Burden across Stages of Preclinical Alzheimer's Disease
Abstract
Objectives: We examined florbetapir positron emission tomography (PET) amyloid scans across stages of preclinical Alzheimer's disease (AD) in cortical, allocortical, and subcortical regions. Stages were characterized using empirically defined methods.
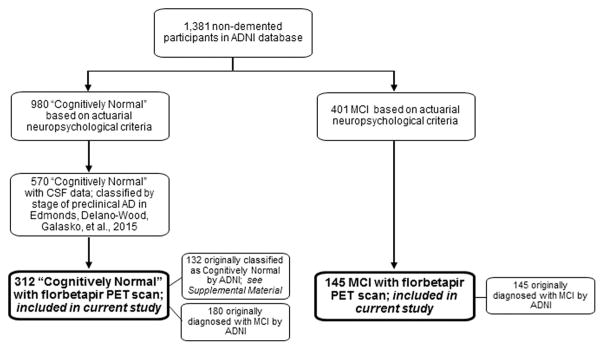
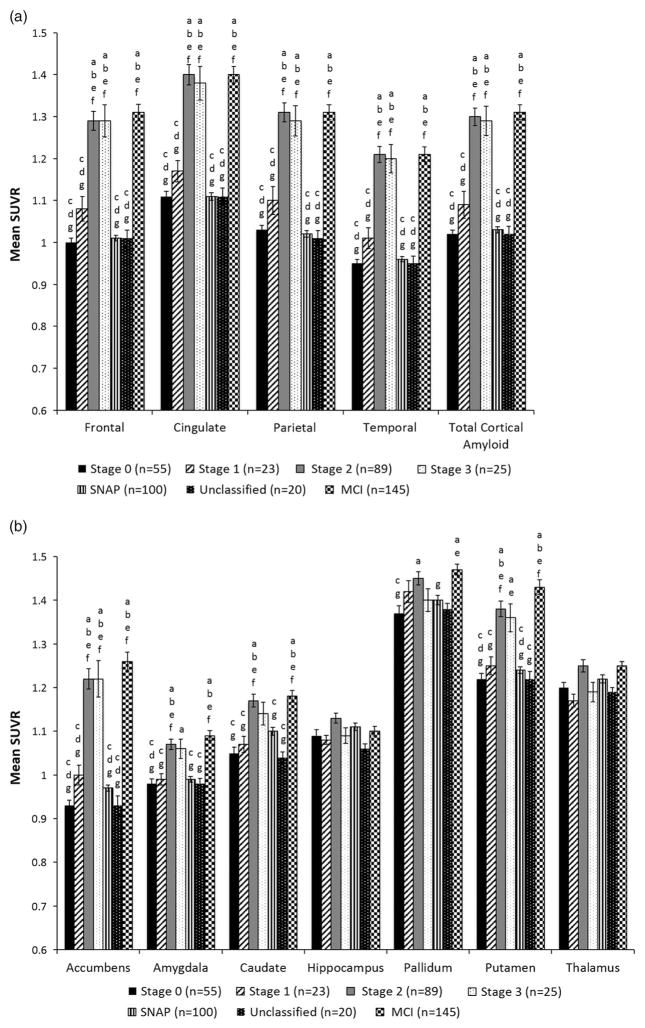
Methods: A total of 312 cognitively normal Alzheimer's Disease Neuroimaging Initiative participants completed a neuropsychological assessment and florbetapir PET scan. Participants were classified into stages of preclinical AD using (1) a novel approach based on the number of abnormal biomarkers/cognitive markers each individual possessed, and (2) National Institute on Aging and the Alzheimer's Association (NIA-AA) criteria. Preclinical AD groups were compared to one another and to a mild cognitive impairment (MCI) sample on florbetapir standardized uptake value ratios (SUVRs) in cortical and allocortical/subcortical regions of interest (ROIs).
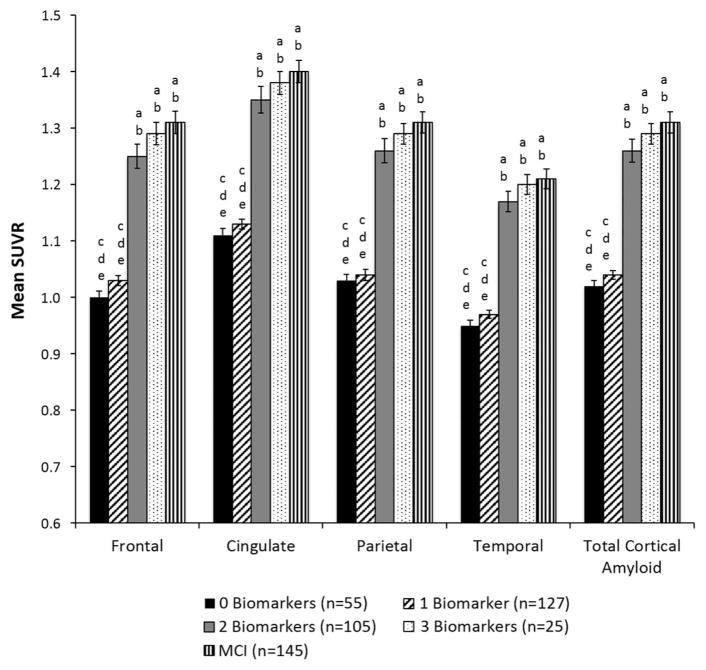
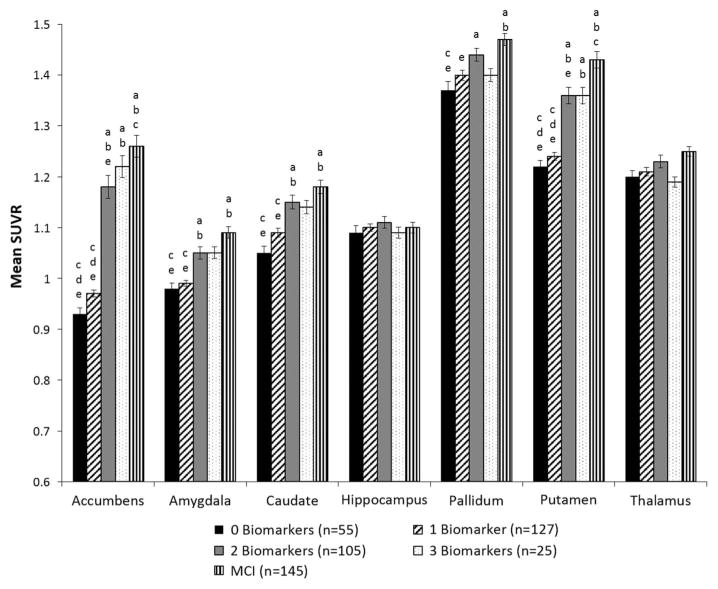
Results: Amyloid deposition increased across stages of preclinical AD in all cortical ROIs, with SUVRs in the later stages reaching levels seen in MCI. Several subcortical areas showed a pattern of results similar to the cortical regions; however, SUVRs in the hippocampus, pallidum, and thalamus largely did not differ across stages of preclinical AD.
Conclusions: Substantial amyloid accumulation in cortical areas has already occurred before one meets criteria for a clinical diagnosis. Potential explanations for the unexpected pattern of results in some allocortical/subcortical ROIs include lack of correspondence between (1) cerebrospinal fluid and florbetapir PET measures of amyloid, or between (2) subcortical florbetapir PET SUVRs and underlying neuropathology. Findings support the utility of our novel method for staging preclinical AD. By combining imaging biomarkers with detailed cognitive assessment to better characterize preclinical AD, we can advance our understanding of who is at risk for future progression. (JINS, 2016, 22, 978-990).
Keywords: Alzheimer disease; Beta-amyloid peptides; Biomarkers; Dementia; Florbetapir; Neuropsychology; Positron emission tomography.
Figures
Similar articles
-
Financial Management Skills in Aging, MCI and Dementia: Cross Sectional Relationship to 18F-Florbetapir PET Cortical β-amyloid Deposition.J Prev Alzheimers Dis. 2019;6(4):274-282. doi: 10.14283/jpad.2019.26. J Prev Alzheimers Dis. 2019. PMID: 31686100
-
Imaging characteristic of dual-phase (18)F-florbetapir (AV-45/Amyvid) PET for the concomitant detection of perfusion deficits and beta-amyloid deposition in Alzheimer's disease and mild cognitive impairment.Eur J Nucl Med Mol Imaging. 2016 Jul;43(7):1304-14. doi: 10.1007/s00259-016-3359-8. Epub 2016 Mar 22. Eur J Nucl Med Mol Imaging. 2016. PMID: 27003417
-
Using positron emission tomography and florbetapir F18 to image cortical amyloid in patients with mild cognitive impairment or dementia due to Alzheimer disease.Arch Neurol. 2011 Nov;68(11):1404-11. doi: 10.1001/archneurol.2011.150. Epub 2011 Jul 11. Arch Neurol. 2011. PMID: 21747008
-
18F PET with florbetapir for the early diagnosis of Alzheimer's disease dementia and other dementias in people with mild cognitive impairment (MCI).Cochrane Database Syst Rev. 2017 Nov 22;11(11):CD012216. doi: 10.1002/14651858.CD012216.pub2. Cochrane Database Syst Rev. 2017. PMID: 29164603 Free PMC article. Review.
-
Use of amyloid PET across the spectrum of Alzheimer's disease: clinical utility and associated ethical issues.Amyloid. 2014 Sep;21(3):143-8. doi: 10.3109/13506129.2014.926267. Epub 2014 Jun 11. Amyloid. 2014. PMID: 24919109 Review.
Cited by
-
A Three-Factor Structure of Cognitive Functioning Among Unimpaired Carriers and Non-Carriers of Autosomal-Dominant Alzheimer's Disease.J Alzheimers Dis. 2018;65(1):107-115. doi: 10.3233/JAD-180078. J Alzheimers Dis. 2018. PMID: 30040714 Free PMC article.
-
Advanced Immunolabeling Method for Optical Volumetric Imaging Reveals Dystrophic Neurites of Dopaminergic Neurons in Alzheimer's Disease Mouse Brain.Mol Neurobiol. 2024 Jul;61(7):3976-3999. doi: 10.1007/s12035-023-03823-9. Epub 2023 Dec 4. Mol Neurobiol. 2024. PMID: 38049707 Free PMC article.
-
Imaging biomarkers in neurodegeneration: current and future practices.Alzheimers Res Ther. 2020 Apr 27;12(1):49. doi: 10.1186/s13195-020-00612-7. Alzheimers Res Ther. 2020. PMID: 32340618 Free PMC article. Review.
-
Amyloidosis increase is not attenuated by long-term calorie restriction or related to neuron density in the prefrontal cortex of extremely aged rhesus macaques.Geroscience. 2020 Dec;42(6):1733-1749. doi: 10.1007/s11357-020-00259-0. Epub 2020 Sep 2. Geroscience. 2020. PMID: 32876855 Free PMC article.
-
Integrating amyloid imaging and genetics for early risk stratification of Alzheimer's disease.Alzheimers Dement. 2024 Nov;20(11):7819-7830. doi: 10.1002/alz.14244. Epub 2024 Sep 17. Alzheimers Dement. 2024. PMID: 39285750 Free PMC article.
References
-
- Arriagada PV, Growdon JH, Hedley-Whyte ET, Hyman BT. Neurofibrillary tangles but not senile plaques parallel duration and severity of Alzheimer’s disease. Neurology. 1992;42:631–639. - PubMed
-
- Beach TG, Thal DR, Zanette M, Smith A, Buckley C. Detection of striatal amyloid plaques with [18F] flutemetamol: Validation with postmortem histopathology. Journal of Alzheimer’s Disease. 2016;52:863–873. - PubMed
Publication types
MeSH terms
Substances
Grants and funding
LinkOut - more resources
Full Text Sources
Other Literature Sources
Medical
