. 2016 Nov 23;36(47):11946-11958.
doi: 10.1523/JNEUROSCI.0672-16.2016.

Negative Allosteric Modulation of mGluR5 Partially Corrects Pathophysiology in a Mouse Model of Rett Syndrome

Affiliations

Negative Allosteric Modulation of mGluR5 Partially Corrects Pathophysiology in a Mouse Model of Rett Syndrome

Jifang Tao et al. J Neurosci. .

Abstract

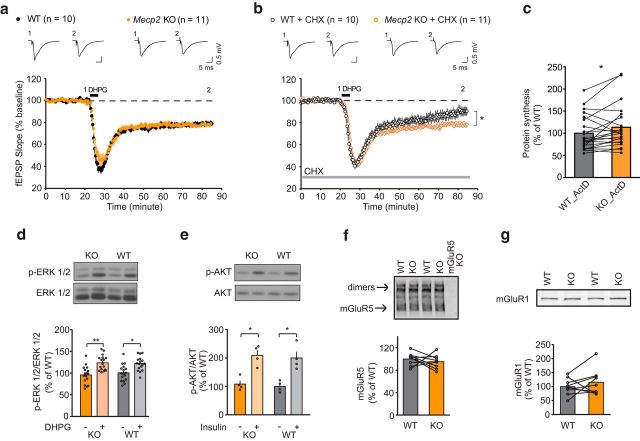
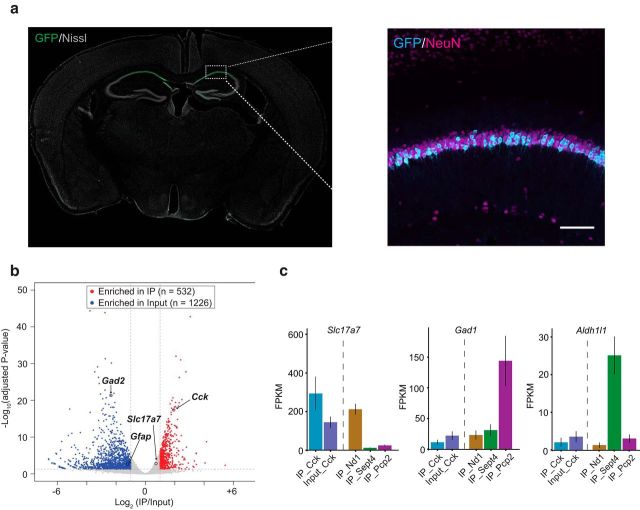
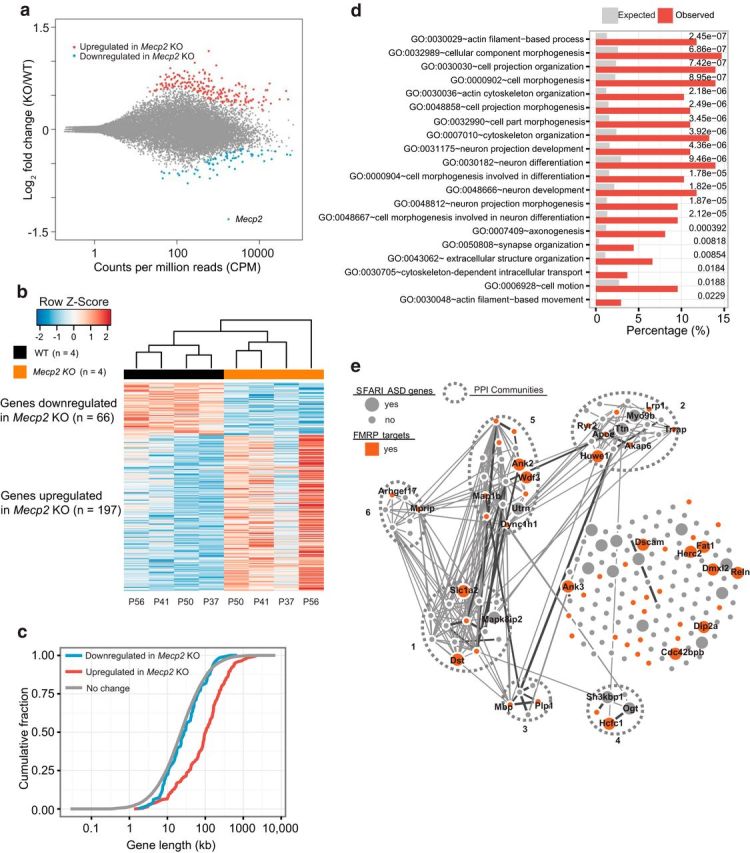
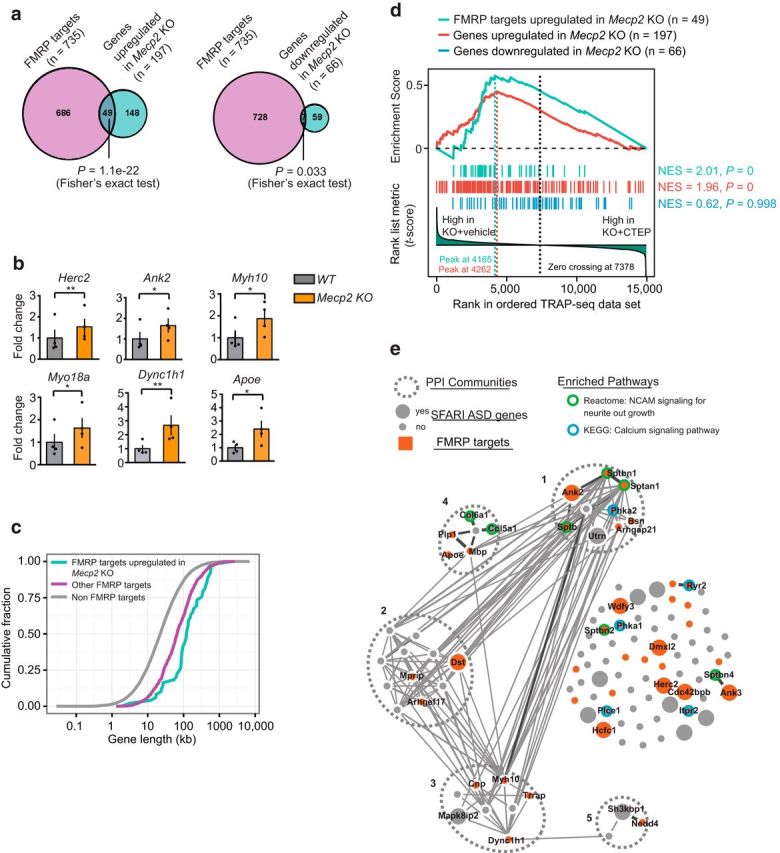
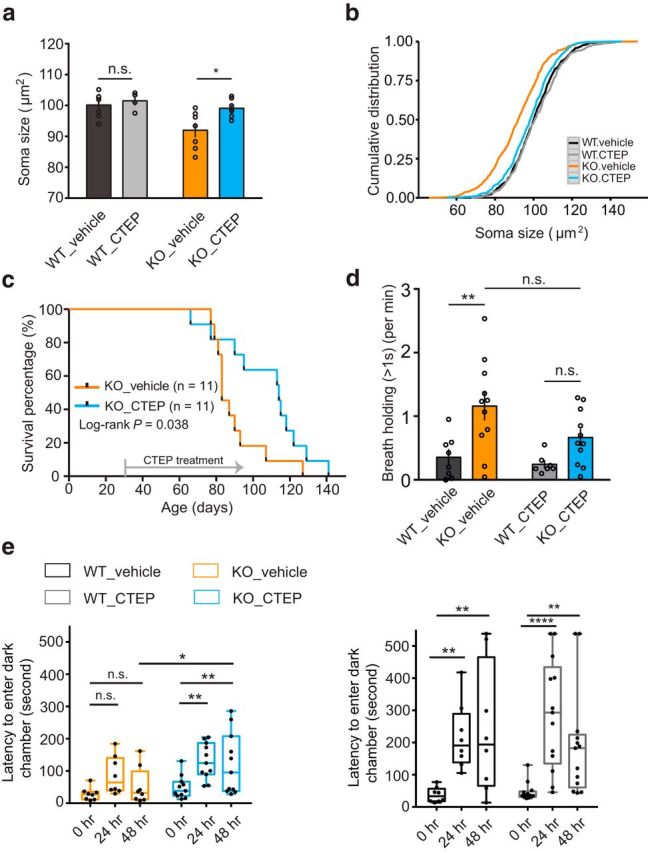
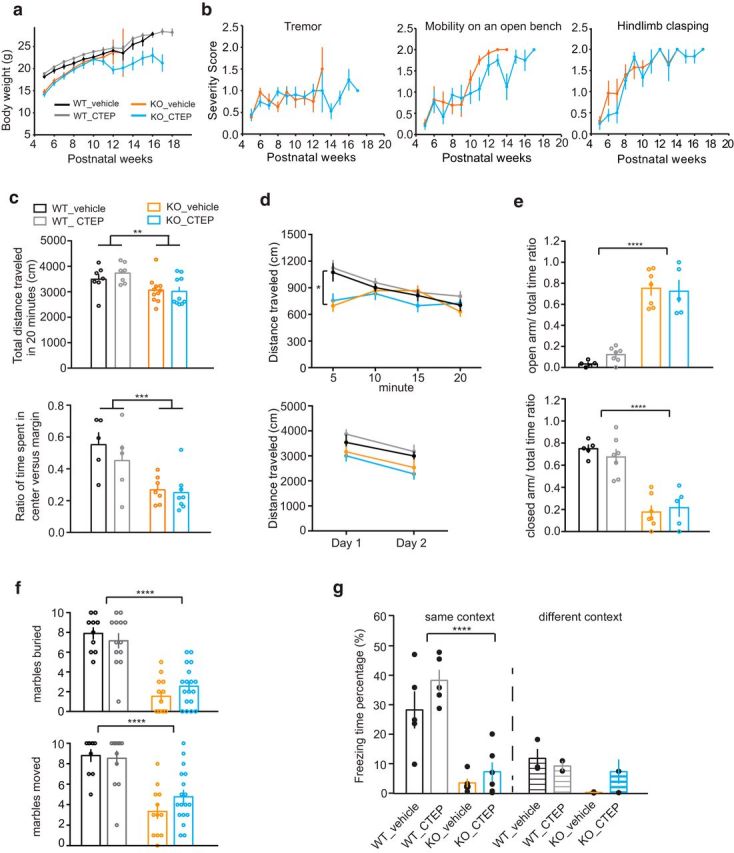
Rett syndrome (RTT) is caused by mutations in the gene encoding methyl-CpG binding protein 2 (MECP2), an epigenetic regulator of mRNA transcription. Here, we report a test of the hypothesis of shared pathophysiology of RTT and fragile X, another monogenic cause of autism and intellectual disability. In fragile X, the loss of the mRNA translational repressor FMRP leads to exaggerated protein synthesis downstream of metabotropic glutamate receptor 5 (mGluR5). We found that mGluR5- and protein-synthesis-dependent synaptic plasticity were similarly altered in area CA1 of Mecp2 KO mice. CA1 pyramidal cell-type-specific, genome-wide profiling of ribosome-bound mRNAs was performed in wild-type and Mecp2 KO hippocampal CA1 neurons to reveal the MeCP2-regulated "translatome." We found significant overlap between ribosome-bound transcripts overexpressed in the Mecp2 KO and FMRP mRNA targets. These tended to encode long genes that were functionally related to either cytoskeleton organization or the development of neuronal connectivity. In the Fmr1 KO mouse, chronic treatment with mGluR5-negative allosteric modulators (NAMs) has been shown to ameliorate many mutant phenotypes by correcting excessive protein synthesis. In Mecp2 KO mice, we found that mGluR5 NAM treatment significantly reduced the level of overexpressed ribosome-associated transcripts, particularly those that were also FMRP targets. Some Rett phenotypes were also ameliorated by treatment, most notably hippocampal cell size and lifespan. Together, these results suggest a potential mechanistic link between MeCP2-mediated transcription regulation and mGluR5/FMRP-mediated protein translation regulation through coregulation of a subset of genes relevant to synaptic functions.

Significance statement: Altered regulation of synaptic protein synthesis has been hypothesized to contribute to the pathophysiology that underlies multiple forms of intellectual disability and autism spectrum disorder. Here, we show in a mouse model of Rett syndrome (Mecp2 KO) that metabotropic glutamate receptor 5 (mGluR5)- and protein-synthesis-dependent synaptic plasticity are abnormal in the hippocampus. We found that a subset of ribosome-bound mRNAs was aberrantly upregulated in hippocampal CA1 neurons of Mecp2 KO mice, that these significantly overlapped with FMRP direct targets and/or SFARI human autism genes, and that chronic treatment of Mecp2 KO mice with an mGluR5-negative allosteric modulator tunes down upregulated ribosome-bound mRNAs and partially improves mutant mice phenotypes.

Keywords: Rett syndrome; autism; fragile X; intellectual disability; metabotropic glutamate receptor; synaptic protein synthesis.


Figures

Figure 1.
Figure 1.
Mecp2 KO mice exhibited dysregulated protein-synthesis-dependent mGluR-LTD in hippocampus. a, DHPG (50 μm; 5 min) induced comparable magnitudes of mGluR-LTD in hippocampal slices of P30∼P35 littermate WT (22.1 ± 1.6%, n = 10 mice) and Mecp2 KO (22.7 ± 1.4%, n = 11). b, The protein synthesis inhibitor CHX significantly reduced mGluR-LTD in WT (11.0 ± 4%, n = 10 mice), but did not alter mGluR-LTD in Mecp2 KO (20.9 ± 1.6%, n = 11). Statistics: 2-way ANOVA, interaction p = 0.031, genotype p = 0.021, treatment p = 0.006. Tukey's multiple-comparisons test WT vs WT+CHX **, KO vs KO+CHX ns (in this and subsequent figures, *p < 0.05; **p < 0.01; ***p < 0.001). c, Metabolic labeling of P30∼P35 hippocampal slices revealed a significant increase in basal protein synthesis in Mecp2 KO mice (KO: 113 ± 10%, n = 22 mice) compared with WT littermate (WT: 100 ± 8.4%, n = 22) (paired t test, p = 0.03). d, ERK1/2 phosphorylation were comparable between P30∼P35 WT and Mecp2 KO hippocampal slices stimulated with DHPG (50 μm, 5 min) (WT: 100 ± 4.6%, WT + DHPG: 122 ± 3.9%, KO: 95.7 ± 4.9%, KO + DHPG: 123.5 ± 4.2%, n = 17 animals for both WT and KO) (2-way ANOVA, treatment p < 0.0001, interaction and genotype n.s, Sidak's multiple-comparisons test WT vs WT + DHPG, p < 0.001, KO vs KO + DHPG, p < 0.0005). e, AKT phosphorylation was comparable between P30∼P35 WT and Mecp2 KO hippocampal slices stimulated with insulin (1 μm, 10 min) (WT: 100 ± 9.6%, WT + insulin: 200 ± 21%, KO: 108 ± 11.7%, KO + insulin: 209 ± 17.6%, n = 4 animals for both WT and KO) (2-way ANOVA, treatment p = 0.0009, interaction and genotype n.s., Sidak's multiple-comparisons test WT versus WT+DHPG, p < 0.05, KO vs KO+DHPG, p < 0.05). f, Normalized ratio of mGluR5 expression level to total protein amount between P30∼P35 WT and KO littermates was not significantly altered (WT: 1 ± 3.7%, n = 9; KO: 95 ± 4.0%, n = 9, 2-tailed paired t test p = 0.459). g, Normalized ratio of mGluR1 expression level to total protein amount between P30∼P35 WT and KO littermates was not significantly altered (WT: 100 ± 9.8%, n = 9; KO: 115.6 ± 15.6%, n = 9, 2-tailed paired t test p = 0.328).
Figure 2.
Figure 2.
Characterization of Cck-bacTRAP line and immunoprecipitation of ribosome associated mRNAs from hippocampal CA1 neurons. a, Coronal section of a Cck-bacTRAP mouse brain stained for GFP and Nissl. Inset picture is an immunohistochemistry image of hippocampus with antibodies against GFP (cyan) and NeuN (magenta) showing colocalization in CA1. Scale bar, 100 μm. b, Volcano plot analysis revealed transcripts specifically enriched in Cck-bacTRAP IP samples versus input samples (whole hippocampus lysates). Red dots represent transcripts that were significantly enriched in IP samples (e.g., Cck) and blue dots represent transcripts that were significantly enriched in input samples (e.g., Gfap, Gad2). c, Quantification of expression levels of Slc17a7 (Vglut1, excitatory neuron marker), Gad1 (inhibitory neuron marker), and Aldh1l1 (glial marker) across different bacTRAP lines expressing in different cell types: Cck (hippocampal CA1, from current study), Nd1 (cerebellar granule neuron), Sept4 (cerebellar Bergmann glia), Pcp2 (cerebellar Purkinje cell); the latter three are all published datasets from Dr. Heintz's group (Mellén et al., 2012). FPKM, Fragments per kilobase of transcript per million mapped reads.
Figure 3.
Figure 3.
Analysis of MeCP2-regulated ribosome-associated mRNAs in hippocampal CA1 neurons. a, MA plot (DESeq2) showing log2-fold changes between Mecp2 KO/WT over the mean of normalized transcript counts. TRAP-seq analyzed translating mRNAs isolated from hippocampal CA1 neurons in WT Cck bacTRAP mice (n = 4) and Mecp2 KO Cck-bacTRAP mice (n = 4). Red dots represent transcripts that were significantly upregulated in Mecp2 KO (n = 197, false discovery rate [FDR] = 0.1) and blue dots represent transcripts that were significantly downregulated in Mecp2 KO (n = 66, FDR = 0.1). Gray dots represent transcripts not significantly altered. The data point corresponding to the Mecp2 mRNA is indicated. b, Heat map of transcripts that are significantly differentially expressed between WT and Mecp2 KO. Each column represents one biological replicate (animal) (FDR < 0.1) with age marked at the bottom. c, Cumulative distribution of gene lengths for genes upregulated in Mecp2 KO (red), genes downregulated in Mecp2 KO (blue), and all the unaltered genes detected in hippocampal CA1 neurons (gray). Two-sample KS test: upregulated versus no change, p = 4.6 × 10⁻³⁴; downregulated versus no change, p = 0.21. d, Functional annotation analysis of genes upregulated in Mecp2 KO using DAVID Bioinformatics Resources 6.7 (National Institute of Allergy and Infectious Diseases–National Institutes of Health). The top 20 enriched GO terms with p < 0.05 (corrected for multiple comparisons by Benjamin adjustment) are shown with expected (gray bars) and observed (red bars) percentages of genome. e, PPI network analysis of 197 genes upregulated in Mecp2 KO generated by the GeNets algorithm using the InWeb PPI database (https://www.broadinstitute.org/genets). Curated and computationally derived PPIs are shown as lines. Line thickness reflects the level of confidence in the interaction. Sets of genes more connected with each other than to other groups of genes are defined as PPI communities and are enclosed by the ovals bounded by dashed lines. Genes without known PPI are arrayed to the right side. This analysis identified six distinct PPI communities within 197 MeCP2-repressed genes. Each community gene list is submitted to DAVID functional annotation tool. Community 1 is enriched for actin cytoskeleton and neuron projection. Community 5 is enriched for actin binding, cell junction, and synapse. In addition, genes that are identified as SFARI ASD genes (https://gene.sfari.org/autdb/HG_Home.do) are highlighted as larger nodes, whereas those overlapping with FMRP-bound targets are highlighted in red. Gene names are indicated for those that are identified as SFARI ASD genes and/ or FMRP targets.
Figure 4.
Figure 4.
Genes upregulated in Mecp2 KO have a significant overlap with FMRP direct mRNA targets. The list of FMRP directly associated mRNAs from the mouse brain tissue is from published datasets (Darnell et al., 2011). a, Venn diagrams showing a significant overlap between FMRP direct mRNA targets and mRNAs upregulated in Mecp2 KO (Fisher's exact test, p = 1.1 × 10⁻²²) and a fewer number of genes overlapping between FMRP direct targets and mRNAs downregulated in Mecp2 KO (Fisher's exact test p = 0.033). b, Validation of TRAP-seq identified target genes that were shared between genes upregulated in Mecp2 KO and FMRP direct mRNA targets by qPCR. Two-tailed paired t tests: Herc2 p = 0.0099 **, Ank2 p = 0.0296 *, Myh10 p = 0.0335 *, Apoe p = 0.0117 *, Myo18a p = 0.02 *, Dync1h1 p = 0.0039 **, n = 4 animals. c, Cumulative distribution of gene lengths for FMRP targets upregulated in Mecp2 KO (cyan), other FMRP direct targets (magenta), and the rest of mRNAs that are non-FMRP targets (gray). Two-sample KS test: FMRP targets upregulated in Mecp2 KO versus other FMRP targets p = 6.3 × 10⁻⁵, other FMRP targets versus non-FMRP targets p = 1.2 × 10−67. d, GSEA of genes upregulated in Mecp2 KO (red vertical bars, n = 197), upregulated in Mecp2 KO/FMRP-bound mRNAs (cyan vertical bars, n = 49), or genes downregulated in Mecp2 KO (blue vertical bars, n = 66 genes) on a ranked list of genes differentially expressed between vehicle-treated and CTEP-treated Mecp2 KO hippocampal CA1 neurons. Genes that are relatively downregulated in CTEP-treated Mecp2 KO are displayed on the left side of the plot. The red and cyan line in the upper part of the plot indicates the GSEA enrichment running scores for the list of genes upregulated or downregulated in Mecp2 KO, respectively. The vertical dash lines indicate the peaks corresponding to enrichment score (ES). e, PPI network analysis of a subset of genes upregulated in Mecp2 KO that are downregulated by the CTEP treatment (n = 108 leading edge genes). This analysis identified five distinct PPI communities. In addition, genes that are identified as SFARI ASD genes are highlighted as larger nodes, whereas those overlapping with FMRP-bound targets are highlighted in red. Genes significantly enriched in two functionally relevant pathways are labeled with green outer-circle (NCAM signaling for neurite out growth, adjusted-p = 5.8 × 10⁻⁷) or blue outer-circle (Calcium signaling pathway, adjusted-p = 1.7 × 10⁻²), respectively. Gene names are indicated for those that are enriched in the two pathways.
Figure 5.
Figure 5.
Chronic CTEP treatments of Mecp2 KO mice ameliorates hippocampal reduced soma size, prolongs lifespan, partially reduces long breath holdings, and ameliorates IA deficits. a, CTEP treatment ameliorates reduced neuronal soma size shown by averaged soma size by animals (WT_vehicle 100.17 ± 1.52 n = 7, WT_CTEP 101.51 ± 1.48 n = 4, KO_vehicle 91.99 ± 2.3 n = 7, KO_CTEP 99.11 ± 1.09 n = 7, 2-way ANOVA, interaction p = 0.123, drug treatment p = 0.028, genotype p = 0.008, Sidak's multiple-comparisons test WT_vehicle vs WT_CTEP n.s., KO_vehicle vs KO_CTEP *). b, CTEP treatment ameliorates reduced neuronal soma size in hippocampal CA1 neurons shown in cumulative distribution by cell numbers [KS test: WT_CTEP (n = 322 cells) vs WT_vehicle (n = 500 cells) p = 0.346, KO_vehicle vs WT_vehicle p = 0, KO_vehicle (n = 419 cells) vs KO_CTEP (n = 483 cells) p = 9.08 × 10⁻¹², KO_CTEP vs WT_vehicle p = 0.042]. c, Kaplan–Meier survival curve showed that Mecp2 KO mice with treated CTEP survived longer than littermates treated with vehicle (KO_vehicle: n = 11 median survival is 83 d, KO_CTEP: n = 11, median survival is 113 d. Log-rank test, p = 0.038). d, Whole-body plethysmography analyses showed that CTEP treatment may partially reduce long breath holdings (>1 s) in Mecp2 KO mice (WT_vehicle 0.355 ± 0.118, n = 8; WT_CTEP 0.244 ± 0.056, n = 7; KO_vehicle 1.159 ± 0.218, n = 11; KO_CTEP 0.663 ± 0.129, n = 11; 2-way ANOVA, interaction p = 0.251, treatment p = 0.0748, genotype p = 0.0008, Tukey's multiple-comparisons test WT_vehicle vs KO_vehicle **, KO_vehicle vs WT_CTEP **, WT_CTEP vs KO_CTEP n.s., WT_vehicle vs KO_CTEP ns, WT_vehicle vs WT_CTEP n.s., KO_vehicle vs KO_CTEP n.s.). e, CTEP treatment ameliorated IA deficits in Mecp2 KO mice. CTEP treatment did not alter acquisition of IA in WT mice (WT_vehicle: 0 h 37.26 ± 8.26 n = 8, 24 h 217.36 ± 36.32 n = 8; 48 h 237.95 ± 71.17; WT_CTEP: 0 h 46.45 ± 7.92, 24 h 288.48 ± 47.71, 48 h 193.61 ± 46.36, n = 13, 2-way RM-ANOVA, interaction p = 0.286, treatment p = 0.794, time p < 0.0001; Sidak's multiple-comparisons test: 0 h vs 24 h **, 0 h vs 48 h **, 24 h vs 48 h ns, WT_vehicle n = 8; 0 h vs 24 h ****, 0 h vs 48 h **, 24 h vs 48 h n.s., WT_CTEP n = 13). CTEP treatment ameliorated acquisition deficits in Mecp2 KO mice (KO_vehicle: 0 h 28.59 ± 7.04, 24 h 86.6 ± 20.62, 48 h 52.21 ± 20.00 n = 8; KO_CTEP: 0 h 49.16 ± 10.73, 24 h 130.22 ± 16.80, 48 h 121.29 ± 28.81, n = 11; 2-way RM-ANOVA, interaction p = 0.383, treatment p = 0.036, time p = 0.001; Sidak's multiple-comparisons test: KO_vehicle n = 8, 0 h vs 24 h n.s., 0 h vs 48 h n.s., 24 h vs 48 h n.s.; KO_CTEP n = 11, 0 h vs 24 h **, 0 h vs 48 h **, 24 h vs 48 h n.s.; KO_vehicle vs KO_CTEP 48 h *).
Figure 6.
Figure 6.
CTEP treatment of Mecp2 KO mice does not improve body weight, tremor, hindlimb clasping, mobility, or anxiety deficits. a, b, CTEP treatment does not improve body weight, tremor, hindlimb clasping, or mobility on an open bench (severity score: 0 equals WT, 1 is partially impaired, 2 is severely impaired). c, Open-field test showing that Mecp2 KO mice traveled less than WT littermates in a 20 min window regardless of vehicle or CTEP treatment (2-way ANOVA, genotype p = 0.0025, treatment and interaction ns, WT_V n = 7, WT_CTEP n = 7, KO_V n = 11, KO_CTEP n = 10). The same open-field test also showed that Mecp2 KO mice spent less time in the center versus margin of the test arena compared with WT littermates regardless of vehicle or CTEP treatment (2-way ANOVA, genotype p = 0.0006, treatment and interaction not significant, WT_V n = 5, WT_CTEP n = 5, KO_V n = 7, KO_CTEP n = 8). d, Open-field test on the first day divided into bins of 5 min showed that, whereas WT littermate ran the most distance during the first 5 min and then gradually reduced exploration, Mecp2 KO mice did not reach peak exploration until 10 min later (2-way RM-ANOVA, WT_V vs KO_V: interaction p = 0.0004, time p < 0.0001, genotype p = 0.103; KO_V vs KO_CTEP: interaction p = 0.0591, time p = 0.0093, treatment p = 0.8284). Open-field test on 2 consecutive days showed that both WT and KO mice regardless of drug treatment habituated to the environment (2-way RM-ANOVA, WT_V vs KO_V: interaction p = 0.776, time p = 0.003, genotype p = 0.22; KO_V vs KO_D: interaction p = 0.737, time p = 0.0003, treatment p = 0.477). e, Regardless of CTEP treatment, compared with WT, Mecp2 KO mice spent more time in the open arm than in the closed arm in the elevated plus maze (WT_vehicle_open arm: 0.033 ± 0.013 n = 5; WT_CTEP_open arm: 0.121 ± 0.027 n = 7; KO_vehicle_open arm: 0.752 ± 0.065 n = 7; KO_CTEP_open arm: 0.725 ± 0.102 n = 5; WT_vehicle_closed arm: 0.749 ± 0.034 n = 5; WT_CTEP_closed arm: 0.675 ± 0.067 n = 7; KO_vehicle_closed arm: 0.177 ± 0.056 n = 7; KO_CTEP_closed arm: 0.216 ± 0.078 n = 5, 2-way ANOVA, genotype p < 0.0001). f, Mecp2 KO mice were impaired in a marble-burying test and CTEP treatment did not significantly improve the displacement of marbles (2-way ANOVA, only genotype is significant for both marbles that are moved and marbles that are displaced, p < 0.0001). g, WT mice regardless of CTEP treatment showed robust freezing behavior in the same context but little freezing in a different context (WT_vehicle_same context: 28.26 ± 6.3% n = 5; WT_CTEP_same conext: 38.26 ± 3.64% n = 5; WT_vehicle_different context: 11.84 ± 3.18% n = 3; WT_CTEP_different context: 9.23 ± 1.72% n = 2). Mecp2 KO mice regardless of CTEP treatment showed little freezing behavior in either the same or different context (KO_vehicle_same context: 3.48 ± 1.44% n = 5; KO_CTEP_same context: 7.29 ± 3.18% n = 6; KO_vehicle_different context: 0.25 ± 0.15% n = 2; KO_CTEP_different context: 7.34 ± 4.12% n = 3). Comparison of WT and KO in the same context condition: 2-way ANOVA, interaction p = 0.45, treatment p = 0.099, genotype p < 0.0001.

Similar articles

Cited by

References

    1. Auerbach BD, Osterweil EK, Bear MF. Mutations causing syndromic autism define an axis of synaptic pathophysiology. Nature. 2011;480:63–68. doi: 10.1038/nature10658. - DOI - PMC - PubMed
    1. Barnes SA, Wijetunge LS, Jackson AD, Katsanevaki D, Osterweil EK, Komiyama NH, Grant SG, Bear MF, Nägerl UV, Kind PC, Wyllie DJ. Convergence of hippocampal pathophysiology in Syngap+/− and Fmr1-/y mice. J Neurosci. 2015;35:15073–15081. doi: 10.1523/JNEUROSCI.1087-15.2015. - DOI - PMC - PubMed
    1. Ben-Shachar S, Chahrour M, Thaller C, Shaw CA, Zoghbi HY. Mouse models of MeCP2 disorders share gene expression changes in the cerebellum and hypothalamus. Hum Mol Genet. 2009;18:2431–2442. doi: 10.1093/hmg/ddp181. - DOI - PMC - PubMed
    1. Bhakar AL, Dölen G, Bear MF. The pathophysiology of fragile X (and what it teaches us about synapses) Annu Rev Neurosci. 2012;35:417–443. doi: 10.1146/annurev-neuro-060909-153138. - DOI - PMC - PubMed
    1. Bozdagi O, Sakurai T, Dorr N, Pilorge M, Takahashi N, Buxbaum JD. Haploinsufficiency of Cyfip1 produces fragile X-like phenotypes in mice. PLoS One. 2012;7:e42422. doi: 10.1371/journal.pone.0042422. - DOI - PMC - PubMed

Publication types

MeSH terms

Substances