Inactivation of Regulatory-associated Protein of mTOR (Raptor)/Mammalian Target of Rapamycin Complex 1 (mTORC1) Signaling in Osteoclasts Increases Bone Mass by Inhibiting Osteoclast Differentiation in Mice
- PMID: 27879318
- PMCID: PMC5217679
- DOI: 10.1074/jbc.M116.764761
Inactivation of Regulatory-associated Protein of mTOR (Raptor)/Mammalian Target of Rapamycin Complex 1 (mTORC1) Signaling in Osteoclasts Increases Bone Mass by Inhibiting Osteoclast Differentiation in Mice
Abstract
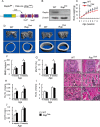
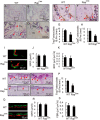
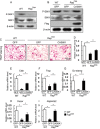
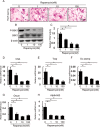
Mammalian target of rapamycin complex 1 (mTORC1) is involved in anabolic metabolism in both osteoblasts and chondrocytes, but the role of mTORC1 in osteoclast biology in vivo remains to be elucidated. In this study, we showed that deletion of regulatory-associated protein of mTOR (Raptor) in osteoclasts led to an increase in bone mass with decreased bone resorption. Raptor-deficient bone marrow-derived macrophages exhibited lower mTORC1-S6K1 signaling and retarded osteoclast differentiation, as determined by the number of osteoclasts, tartrate-resistant acid phosphatase activity, and expression of osteoclast-specific genes. Enforced expression of constitutively active S6K1 rescued the impaired osteoclast differentiation in Raptor-deficient bone marrow-derived macrophages. Furthermore, pharmacological inhibition of mTORC1 signaling by rapamycin could also inhibit osteoclast differentiation and osteoclast-specific gene expression. Taken together, our findings demonstrate that mTORC1 plays a key role in the network of catabolic bone resorption in osteoclasts and may serve as a potential pharmacological target for the regulation of osteoclast activity in bone metabolic disorders.
Keywords: S6 kinase; bone; cell differentiation; mTOR complex (mTORC); osteoclast; osteoporosis.
© 2017 by The American Society for Biochemistry and Molecular Biology, Inc.
Figures


Similar articles
-
mTORC1 Inhibits NF-κB/NFATc1 Signaling and Prevents Osteoclast Precursor Differentiation, In Vitro and In Mice.J Bone Miner Res. 2017 Sep;32(9):1829-1840. doi: 10.1002/jbmr.3172. Epub 2017 Jul 11. J Bone Miner Res. 2017. PMID: 28520214
-
Pasteurella multocida toxin- induced osteoclastogenesis requires mTOR activation.Cell Commun Signal. 2015 Sep 14;13:40. doi: 10.1186/s12964-015-0117-7. Cell Commun Signal. 2015. PMID: 26369790 Free PMC article.
-
mTORC1 and mTORC2 regulate insulin secretion through Akt in INS-1 cells.J Endocrinol. 2013 Jan 2;216(1):21-9. doi: 10.1530/JOE-12-0351. Print 2013 Jan. J Endocrinol. 2013. PMID: 23092880
-
The Macrophage-Osteoclast Axis in Osteoimmunity and Osteo-Related Diseases.Front Immunol. 2021 Mar 31;12:664871. doi: 10.3389/fimmu.2021.664871. eCollection 2021. Front Immunol. 2021. PMID: 33868316 Free PMC article. Review.
-
Regulation of mTORC1 and its impact on gene expression at a glance.J Cell Sci. 2013 Apr 15;126(Pt 8):1713-9. doi: 10.1242/jcs.125773. Epub 2013 May 2. J Cell Sci. 2013. PMID: 23641065 Free PMC article. Review.
Cited by
-
H3K36 trimethylation mediated by SETD2 regulates the fate of bone marrow mesenchymal stem cells.PLoS Biol. 2018 Nov 13;16(11):e2006522. doi: 10.1371/journal.pbio.2006522. eCollection 2018 Nov. PLoS Biol. 2018. PMID: 30422989 Free PMC article.
-
Acacetin Prevents Bone Loss by Disrupting Osteoclast Formation and Promoting Type H Vessel Formation in Ovariectomy-Induced Osteoporosis.Front Cell Dev Biol. 2022 Apr 19;10:796227. doi: 10.3389/fcell.2022.796227. eCollection 2022. Front Cell Dev Biol. 2022. PMID: 35517504 Free PMC article.
-
Adipocytic Glutamine Synthetase Upregulation via Altered Histone Methylation Promotes 5FU Chemoresistance in Peritoneal Carcinomatosis of Colorectal Cancer.Front Oncol. 2021 Oct 12;11:748730. doi: 10.3389/fonc.2021.748730. eCollection 2021. Front Oncol. 2021. PMID: 34712612 Free PMC article.
-
The L-type amino acid transporter LAT1 inhibits osteoclastogenesis and maintains bone homeostasis through the mTORC1 pathway.Sci Signal. 2019 Jul 9;12(589):eaaw3921. doi: 10.1126/scisignal.aaw3921. Sci Signal. 2019. PMID: 31289211 Free PMC article.
-
Introductory review: periostin-gene and protein structure.Cell Mol Life Sci. 2017 Dec;74(23):4259-4268. doi: 10.1007/s00018-017-2643-5. Epub 2017 Sep 7. Cell Mol Life Sci. 2017. PMID: 28884327 Free PMC article. Review.
References
-
- Boyle W. J., Simonet W. S., and Lacey D. L. (2003) Osteoclast differentiation and activation. Nature 423, 337–342 - PubMed
-
- Hadjidakis D. J., and Androulakis I. I. (2006) Bone remodeling. Ann. N.Y. Acad. Sci. 1092, 385–396 - PubMed
-
- Rodan G. A., and Martin T. J. (2000) Therapeutic approaches to bone diseases. Science 289, 1508–1514 - PubMed
MeSH terms
Substances
LinkOut - more resources
Full Text Sources
Other Literature Sources
Molecular Biology Databases
Miscellaneous

