. 2017 Mar 1:114:20-33.
doi: 10.1016/j.neuropharm.2016.11.013. Epub 2016 Nov 19.

Two adjacent phenylalanines in the NMDA receptor GluN2A subunit M3 domain interactively regulate alcohol sensitivity and ion channel gating

Affiliations

Two adjacent phenylalanines in the NMDA receptor GluN2A subunit M3 domain interactively regulate alcohol sensitivity and ion channel gating

Hong Ren et al. Neuropharmacology. .

Abstract

The N-methyl-d-aspartate (NMDA) receptor is a key target of ethanol action in the central nervous system. Alcohol inhibition of NMDA receptor function involves small clusters of residues in the third and fourth membrane-associated (M) domains. Previous results from this laboratory have shown that two adjacent positions in the M3 domain, F636 and F637, can powerfully regulate alcohol sensitivity and ion channel gating. In this study, we report that these positions interact with one another in the regulation of both NMDA receptor gating and alcohol action. Using dual mutant cycle analysis, we detected interactions among various substitution mutants at these positions with respect to regulation of glutamate EC50, steady-state to peak current ratios (Iss:Ip), mean open time, and ethanol IC50. This interaction apparently involves a balancing of forces on the M3 helix, such that the disruption of function due to a substitution at one position can be reversed by a similar substitution at the other position. For example, tryptophan substitution at F636 or F637 increased or decreased channel mean open time, respectively, but tryptophan substitution at both positions did not alter open time. Interestingly, the effects of a number of mutations on receptor kinetics and ethanol sensitivity appeared to depend upon subtle structural differences, such as those between the isomeric amino acids leucine and isoleucine, as they could not be explained on the basis of sidechain molecular volume or hydrophilicity.

Keywords: Ethanol; Glutamate; Ion channel.


Figures

Fig. 1
Fig. 1. Alignment of M3 domains in GluN1 and GluN2 subunits
Sequences of the M3 domains in GluN1 and GluN2A-D subunits are shown, with positions F636 and F637 in the GluN2A subunit in bold type and underlined.
Fig. 2
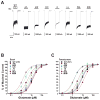
Fig. 2. Dual mutations at F636 and F637 in the M3 domain of the GluN2A subunit influence both peak and steady-state glutamate EC50 values
A, Traces are currents activated by 300 μM glutamate in the presence of 50 μM glycine in lifted HEK 293 cells expressing wild-type GluN1/GluN2A (WT) or various GluN1/GluN2A(F636/F637) mutant subunits. Labels indicate mutations at 636/637 using single-letter amino acid codes. B–C, Concentration-response curves for glutamate-activated peak (Ip) and steady-state (Iss) currents in the presence of 50 μM glycine in lifted HEK 293 cells expressing wild-type GluN1/GluN2A (WT) or various GluN1/GluN2A(F636/F637) mutant subunits. Data points are the means ± S.E. of five to twelve cells, error bars not visible were smaller than the size of the symbols, and the curves shown are the best fits to the equation given in the “Materials and Methods.”
Fig. 3
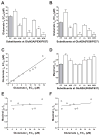
Fig. 3. Comparison of glutamate potency and desensitization among GluN2A F636/F637 dual mutant subunits
A–B, Bar graphs show the average EC50 values for glutamate-activated peak (Ip, A) and steady-state (Iss, B) currents in lifted HEK 293 cells expressing GluN1 and wild- type GluN2A subunits (F/F, gray) or various GluN1/GluN2A(F636/F637) mutant subunits. Asterisks indicate EC50 values that differed from the wild-type value (***P < 0.001; one-way ANOVA). Results are the means ± S. E of 5–12 cells. C, Graph plots values of glutamate log EC50 for peak current in the series of mutants versus values of glutamate log EC50 for steady- state current; these values were significantly correlated (R2 = 0.93, P < 0.001). The line shown is the least-squares fit to the data. D, Bar graph shows the average values of maximal steady-state to peak current ratio (Iss:Ip) in lifted cells coexpressing GluN1 and wild-type GluN2A subunits (F/F, gray) or various GluN1/GluN2A(F636/F637) mutant subunits. Currents were activated by 300 μM glutamate in the presence of 50 μM glycine. Asterisks indicate values that differed significantly from the wild-type value (*P < 0.05, **P < 0.01; one-way ANOVA). Results are the means ± S. E of 5–12 cells.
Fig. 4
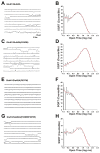
Fig. 4. Tryptophan mutations at F636 and F637 positions interactively regulate mean open time of the NMDA receptor
Traces (A, C, E, G) and open time distributions (B, D, F, H) of single-channel currents activated by 100 nM -1 μM glutamate and 50 μM glycine in outside-out patches from cells expressing wild-type GluN1 subunits and GluN2A wild-type (A,B), F636W (C,D), F637W (E,F), or F636W/F637W (G,H) mutant subunits. Open time distributions were fitted with two exponential components; average values of τ and percentage for all patches are given in the text. Traces and corresponding open time distributions were from the same outside-out patches. Similar results were obtained in 5 to 21 additional patches for each subunit combination.
Fig. 5
Fig. 5. Dual mutations at GluN2A(F636/F637) can alter NMDA receptor ethanol sensitivity
A, Traces are currents activated by 10 μM glutamate and 50 μM glycine and their inhibition by 100 mM ethanol (EtOH) in cells expressing GluN1 and GluN2A wild-type (F/F) or 636/637 mutant subunits. B, Concentration-response curves for ethanol inhibition of glutamate-activated current in cells expressing various substitution mutations at GluN2A(F636/F637). Data are the means ± S.E. of 5–12 cells; error bars not visible were smaller than the size of the symbols. Curves shown are the best fits to the equation given in the Materials and Methods. The black curve shows the fit for the wild-type GluN2A subunit. C, Bar graph shows the average IC50 values for ethanol inhibition of glutamate-activated current in cells expressing GluN1 and wild-type GluN2A subunits (F/F) or GluN2A subunits containing various mutations at F636 and F637. Asterisks indicate IC50 values that are significantly different from the wild- type value (*P < 0.05; **P < 0.01; one-way ANOVA). Results are the means ± S. E of 5–12 cells. The wild-type value is from Ren et al. (2012).
Fig. 6
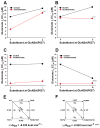
Fig. 6. Positions F636 and F637 in the GluN2A subunit interactively regulate glutamate apparent potency
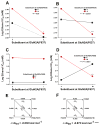
A-D, Graphs plot Ip EC50 values for glutamate versus the substituent at F637 position for various mutants at position F636. Asterisks indicate that interaction free energy (ΔΔGINT) values are significantly different from zero energy (*, P < 0.05; ****, P < 0.0001). E–F, Mutant cycle analysis of glutamate Ip EC50 values in dual isoleucine and tryptophan mutations at GluN2A F636/F637. Apparent free energy values associated with the various mutations (ΔGx) are given in kcal mol−1. Values of ΔΔGINT are the means ± S. E. (*, P < 0.05; ****, P < 0.0001; ). The equation used to calculate ΔΔGINT is given in the Materials and Methods.
Fig. 7
Fig. 7. Positions F636 and F637 in the GluN2A subunit interactively regulate ion channel mean open time
A, Graph plots the mean open time values (in ms) versus the substituent at F637 for the substituent at position F636. Asterisks indicate that interaction free energy (ΔΔGINT) values are significantly different from zero energy (*, P < 0.05). B, Mutant cycle analysis of mean open time for dual tryptophan mutants at GluN2A F636/F637. Apparent free energy values associated with the various mutations (ΔGx) are given in kcal mol−1. Values of ΔΔGINT are the means ± S. E. (*, P < 0.05). The equation used to calculate ΔΔGINT is given in the Materials and Methods.
Fig. 8
Fig. 8. Positions F636 and F637 in the GluN2A subunit interactively regulate ethanol sensitivity
A-D, Graphs plot IC50 values for ethanol versus the substituent at F637 for various mutants at position F636. Asterisks indicate that interaction free energy (ΔΔGINT) values are significantly different from zero energy (*, P < 0.05; ****, P < 0.0001). E–F, Mutant cycle analysis of ethanol IC50 values in dual isoleucine and tryptophan mutations at GluN2A F636/F637. Apparent free energy values associated with the various mutations (ΔGx) are given in kcal mol−1. Values of ΔΔGINT are the means ± S. E. (****, P < 0.0001). The equation used to calculate ΔΔGINT is given in the Materials and Methods.
Fig. 9
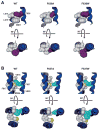
Fig. 9. Altered interactions of phenylalanine side chains at GluN2A positions 636 and 637 with hydrophobic side chains from adjacent helices may explain effects of alanine and tryptophan mutations on mean open time
A, The environment around the phenylalanine at GluN2A 636 (purple) includes two leucine residues at 614–615 and a tryptophan residue at 611 from the GluN1 M2 domain (left). Introduction of an alanine at 636 (center) may decrease the strength of hydrophobic and aromatic interactions, while introduction of a tryptophan (right) could strengthen these interactions. We propose that weakening the interactions at GluN2A position 636 does not influence open time, but strengthening these interactions slows the closing rate, prolonging open time. B, The environment around the phenylalanine at GluN2A 637 (cyan) includes a phenylalanine at 817 and two valine residues at 816 and 820 from the GluN1 M4 domain, and a methionine at 564 in the GluN2A M1 domain (left). Alanine substitution at 637 may diminish hydrophobic interactions with the GluN1 M4 side chains (center), decreasing mean open time. Tryptophan substitution at 637 (right) may decrease mean open time by introducing a steric clash with the methionine at GluN2A 564.
Fig. 10
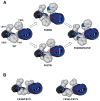
Fig. 10. A simple conceptual model for the effects of mutations at F636 and F637 in the GluN2A M3 domain
A, The GluN1 M4 domain and GluN2A M3 domain helices are shown from the extracellular side; side chains of GluN1 residues M818 and L819 and GluN2A residues F636 and F637 are shown. In the wild-type ion channel (left), the normal balance of forces at this level of the M3 and M4 helices allows for normal gating. Tryptophan substitution at either position 636 or 637 (middle) could alter ion channel gating in opposite directions by shifting the M3 helix (blue arrows) in this region relative to the GluN1 M4 domain (or by altering the forces on M3 in this region) due to interactions with adjacent residues, whereas tryptophan substitution at both positions (right) may restore the balance, and with it, normal ion channel gating. The wild-type structure is that of the rat GluN1/GluN2B receptor from Karakas and Furukawa (2014). The differences in the relative positions of M3 and M4 in the single mutants were made by manually shifting the M3 helix relative to M4; these are for the purpose of illustration and are not intended to represent actual molecular distances. B, The model shown in A with dual isoleucine (left) or leucine (right) substitutions to illustrate the subtle differences in structure between these mutants.

Similar articles

Cited by

References

    1. Colquhoun D. Binding, gating, affinity and efficacy. The interpretation of structure-activity relationships for agonists and of the effects of mutating receptors. Br J Pharmacol. 1998;125:924–47. - PMC - PubMed
    1. Erreger K, Traynelis SF. Allosteric interaction between zinc and glutamate binding domains on NR2A causes desensitization of NMDA receptors. J Physiol. 2005;569:381–93. - PMC - PubMed
    1. Harms JE, Benveniste M, Kessler M, Stone LM, Arai AC, Partin KM. A charge-inverting mutation in the "linker" region of α-amino-3-hydroxy-5-methyl-4-isoxazolepropionic acid (AMPA) receptors alters agonist binding and gating kinetics independently of allosteric modulators. J Biol Chem. 2014;289:10702–14. - PMC - PubMed
    1. Hille B. Ion Channels of Excitable Membranes. Sinauer Associates; Sunderland, MA: 2001.
    1. Honse Y, Ren H, Lipsky RH, Peoples RW. Sites in the fourth membrane-associated domain regulate alcohol sensitivity of the NMDA receptor. Neuropharmacol. 2004;46:647–54. - PubMed

MeSH terms

LinkOut - more resources