

AMBRA1, a novel α-synuclein-binding protein, is implicated in the pathogenesis of multiple system atrophy
- PMID: 27875637
- PMCID: PMC8028368
- DOI: 10.1111/bpa.12461
AMBRA1, a novel α-synuclein-binding protein, is implicated in the pathogenesis of multiple system atrophy
Abstract
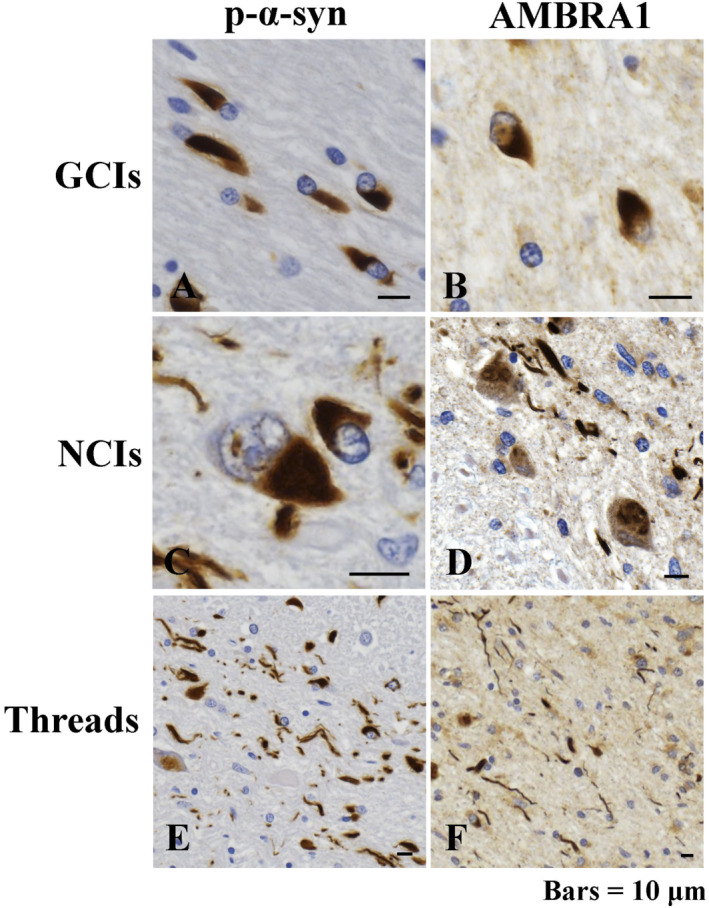
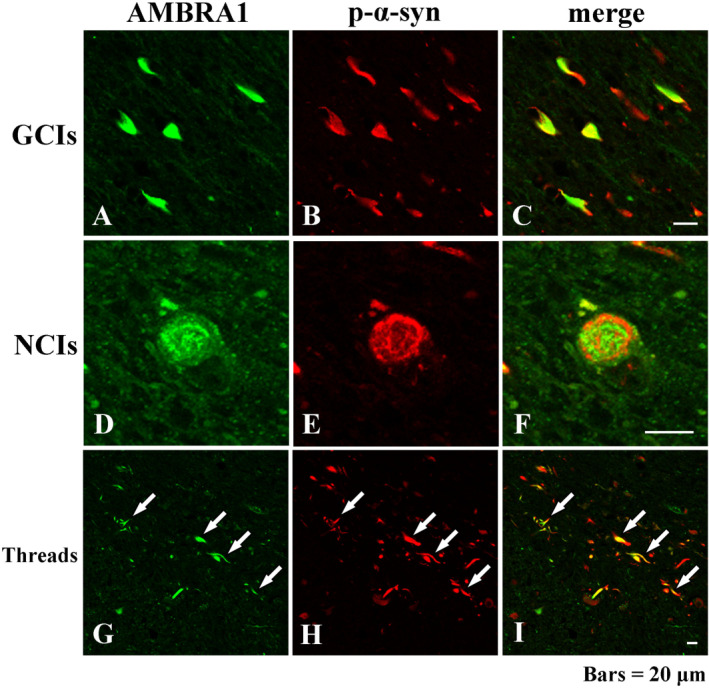
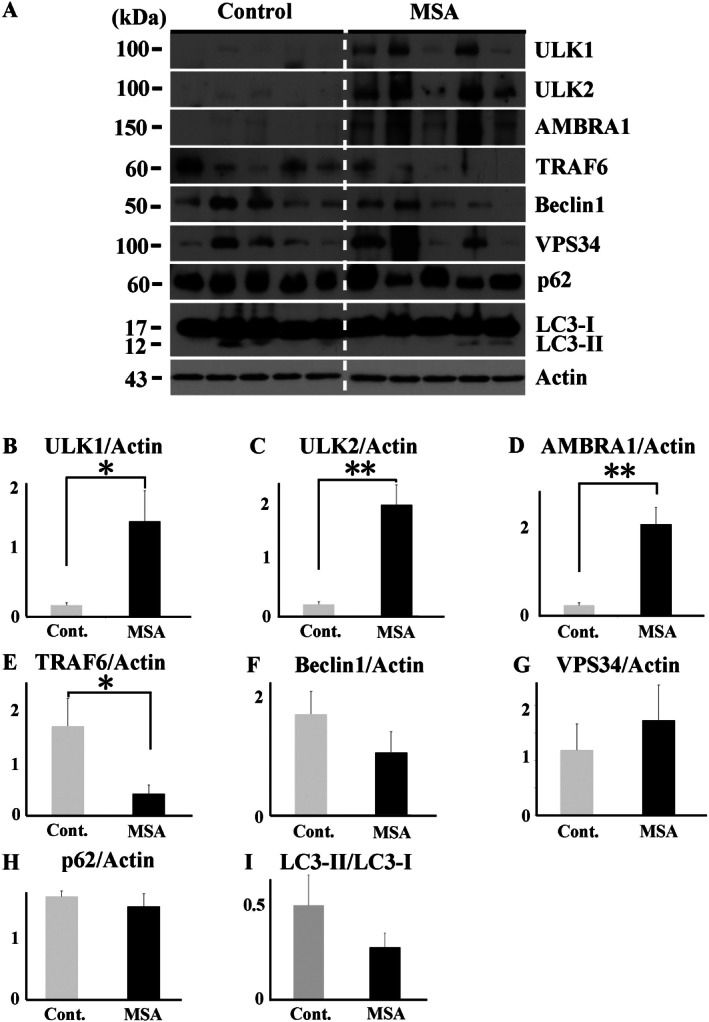
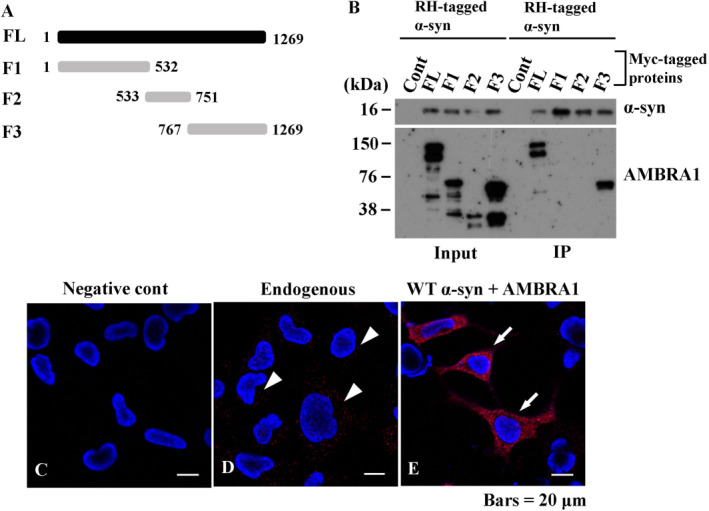
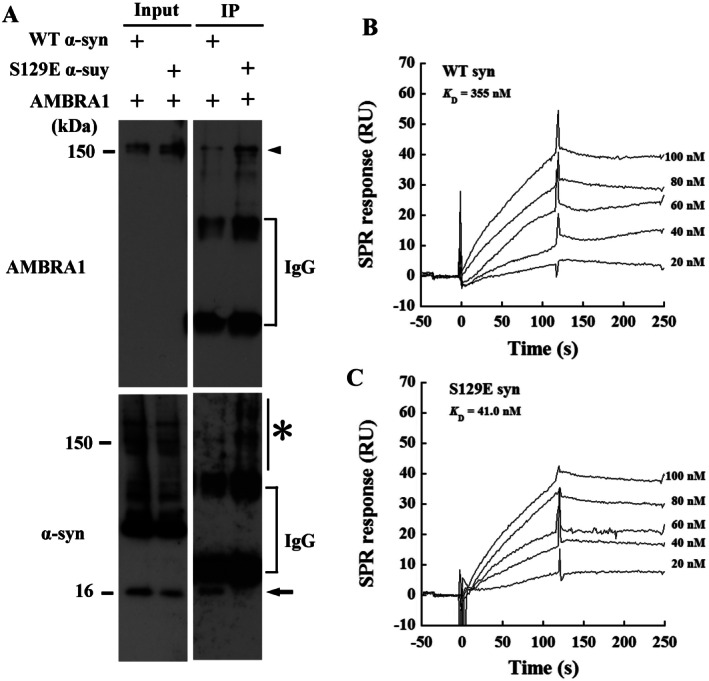
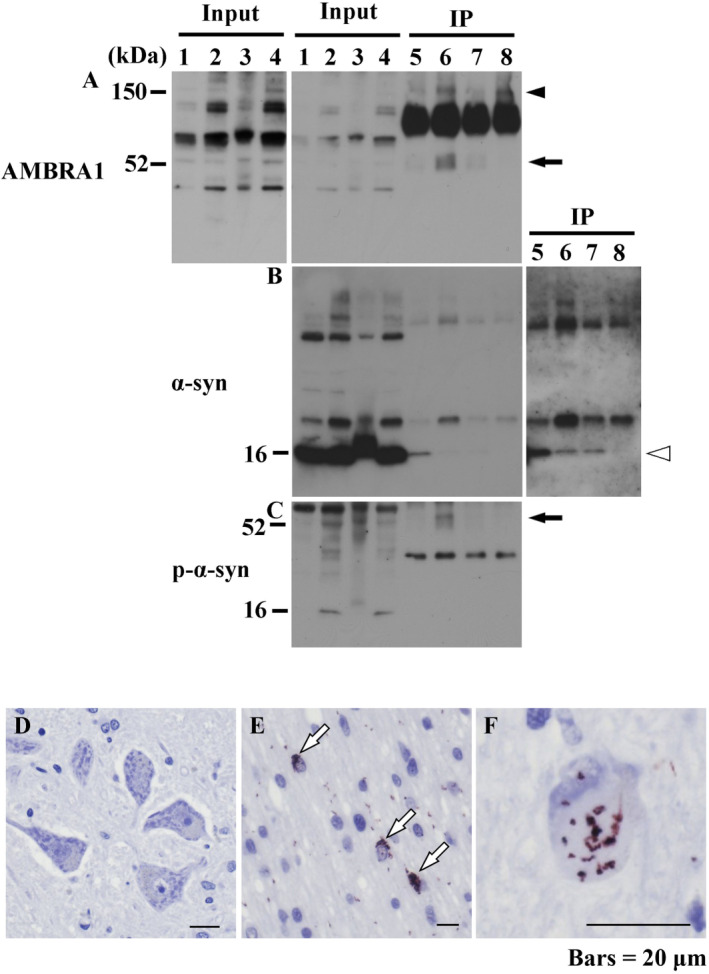
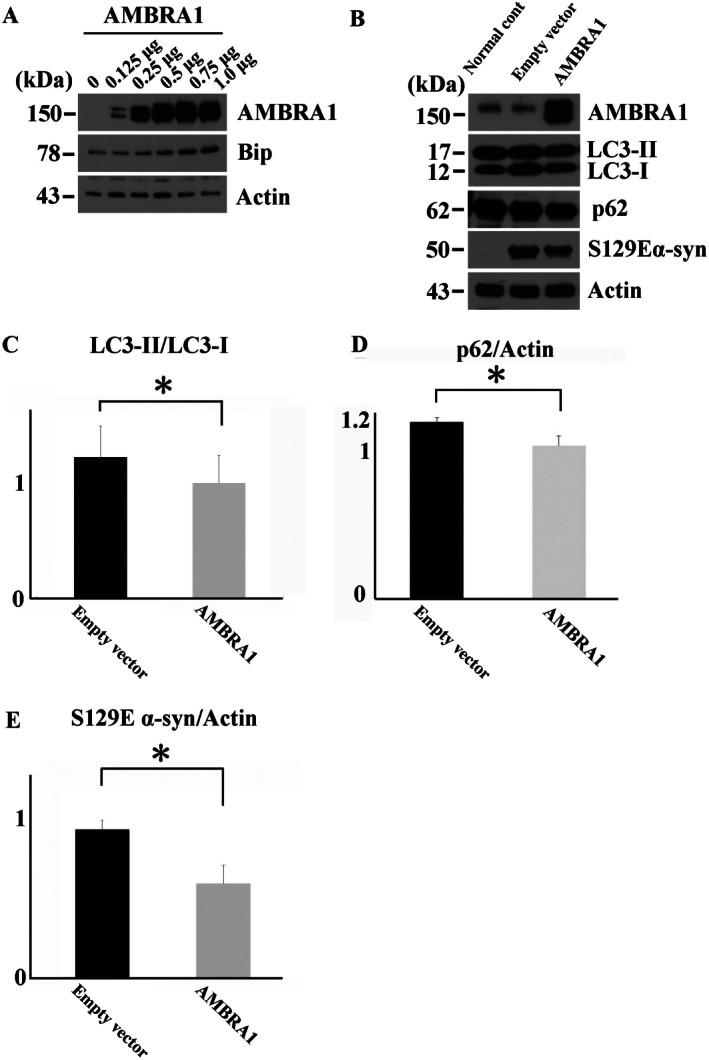
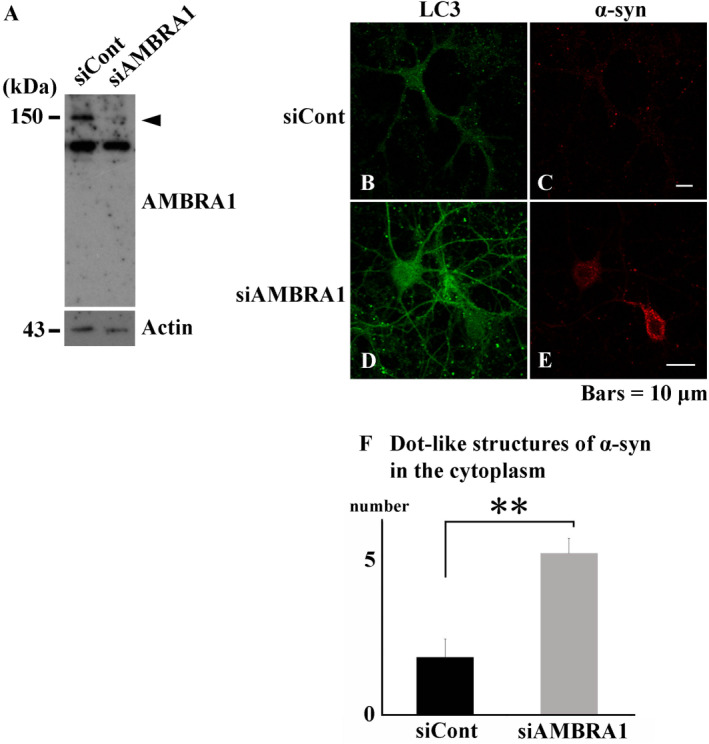
The accumulation of abnormal α-synuclein is the major histopathological feature of Lewy body disease and multiple system atrophy (MSA), which are referred to as synucleinopathies. Cytoplasmic degradation systems, such as the autophagy-lysosome and proteasome pathways, are involved in their pathogenesis. Autophagy is tightly regulated by several upstream proteins including UNC-51-like kinase 1/2, beclin1, vacuolar protein sorting-associated protein 34 and autophagy/beclin1 regulator 1 (AMBRA1). Recently, we revealed that both cortical and brainstem-type Lewy bodies were immunopositive for several upstream proteins of autophagy. Therefore, we conducted the present study to elucidate the role of upstream proteins of autophagy in the pathogenesis of MSA. Pathological and biochemical analyses using human brain samples revealed that AMBRA1 is a component of the pathological hallmarks of MSA and upstream proteins of autophagy are impaired in the MSA brain. In vitro and in vivo analyses revealed a ninefold stronger affinity of AMBRA1 with α-synuclein phosphorylated at serine 129 compared with non-phosphorylated α-synuclein. Furthermore, a weak but significant correlation between AMBRA1 overexpression and reduction of abnormal α-synuclein was observed. Silencing AMBRA1 function caused aggregates of α-synuclein in the cytoplasm of mouse primary cultured neurons, which was simulated by the treatment of Bafilomycin, an autophagy inhibitor. Our results demonstrated for the first time that AMBRA1 is a novel hub binding protein of α-synuclein and plays a central role in the pathogenesis of MSA through the degradative dynamics of α-synuclein. These results raise the possibility that molecular modulation targeting AMBRA1 can be a promising candidate for the treatment of synucleinopathies.
Keywords: AMBRA1; autophagy; multiple system atrophy; synucleinopathy; α-synuclein.
© 2016 International Society of Neuropathology.
Figures
Similar articles
-
Prion-like propagation of human brain-derived alpha-synuclein in transgenic mice expressing human wild-type alpha-synuclein.Acta Neuropathol Commun. 2015 Nov 26;3:75. doi: 10.1186/s40478-015-0254-7. Acta Neuropathol Commun. 2015. PMID: 26612754 Free PMC article.
-
Phosphorylated NUB1 distinguishes α-synuclein in Lewy bodies from that in glial cytoplasmic inclusions in multiple system atrophy.Brain Pathol. 2019 Nov;29(6):803-812. doi: 10.1111/bpa.12728. Epub 2019 May 17. Brain Pathol. 2019. PMID: 31006160 Free PMC article.
-
Alteration of autophagosomal proteins in the brain of multiple system atrophy.Neurobiol Dis. 2013 Jan;49:190-8. doi: 10.1016/j.nbd.2012.08.017. Epub 2012 Aug 29. Neurobiol Dis. 2013. PMID: 22959883
-
Insights into the pathogenesis of multiple system atrophy: focus on glial cytoplasmic inclusions.Transl Neurodegener. 2020 Feb 17;9:7. doi: 10.1186/s40035-020-0185-5. eCollection 2020. Transl Neurodegener. 2020. PMID: 32095235 Free PMC article. Review.
-
[Multiple system atrophy and autophagy].Rinsho Shinkeigaku. 2014;54(12):966-8. doi: 10.5692/clinicalneurol.54.966. Rinsho Shinkeigaku. 2014. PMID: 25519958 Review. Japanese.
Cited by
-
Autophagy mediates the clearance of oligodendroglial SNCA/alpha-synuclein and TPPP/p25A in multiple system atrophy models.Autophagy. 2022 Sep;18(9):2104-2133. doi: 10.1080/15548627.2021.2016256. Epub 2022 Jan 9. Autophagy. 2022. PMID: 35000546 Free PMC article.
-
Multiple system atrophy - a clinicopathological update.Free Neuropathol. 2020 Jul 3;1:1-17. doi: 10.17879/freeneuropathology-2020-2813. eCollection 2020 Jan. Free Neuropathol. 2020. PMID: 37283673 Free PMC article.
-
The Cancermuts software package for the prioritization of missense cancer variants: a case study of AMBRA1 in melanoma.Cell Death Dis. 2022 Oct 15;13(10):872. doi: 10.1038/s41419-022-05318-2. Cell Death Dis. 2022. PMID: 36243772 Free PMC article.
-
Serum miR-96-5P and miR-339-5P Are Potential Biomarkers for Multiple System Atrophy and Parkinson's Disease.Front Aging Neurosci. 2021 Jul 26;13:632891. doi: 10.3389/fnagi.2021.632891. eCollection 2021. Front Aging Neurosci. 2021. PMID: 34381349 Free PMC article.
-
Transplantation of Adipose-Derived Stem Cells Alleviates Striatal Degeneration in a Transgenic Mouse Model for Multiple System Atrophy.Cell Transplant. 2020 Jan-Dec;29:963689720960185. doi: 10.1177/0963689720960185. Cell Transplant. 2020. PMID: 33028107 Free PMC article.
References
-
- Antonioli M, Albiero F, Nazio F, Vescovo T, Perdomo AB, Corazzari M et al (2014) AMBRA1 interplay with cullin E3 ubiquitin ligases regulates autophagy dynamics. Dev Cell 31:734–746. - PubMed
-
- Choi AM, Ryter SW, Levine B (2013) Autophagy in human health and disease. N Engl J Med 368:651–662. - PubMed
-
- Cianfanelli V, De Zio D, Di Bartolomeo S, Nazio F, Strappazzon F, Cecconi F (2015) Ambra1 at a glance. J Cell Sci 128:2003–2008. - PubMed
-
- Damme M, Suntio T, Saftig P, Eskelinen EL (2015) Autophagy in neuronal cells: general principles and physiological and pathological functions. Acta Neuropathol 129:337–362. - PubMed
MeSH terms
Substances
LinkOut - more resources
Full Text Sources
Other Literature Sources
Molecular Biology Databases
Research Materials
Miscellaneous
