Spontaneous Glutamatergic Synaptic Activity Regulates Constitutive COX-2 Expression in Neurons: OPPOSING ROLES FOR THE TRANSCRIPTION FACTORS CREB (cAMP RESPONSE ELEMENT BINDING) PROTEIN AND Sp1 (STIMULATORY PROTEIN-1)
- PMID: 27875294
- PMCID: PMC5207154
- DOI: 10.1074/jbc.M116.737353
Spontaneous Glutamatergic Synaptic Activity Regulates Constitutive COX-2 Expression in Neurons: OPPOSING ROLES FOR THE TRANSCRIPTION FACTORS CREB (cAMP RESPONSE ELEMENT BINDING) PROTEIN AND Sp1 (STIMULATORY PROTEIN-1)
Abstract
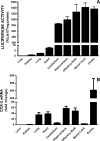
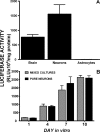
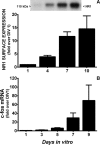
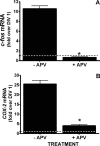
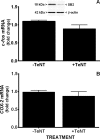
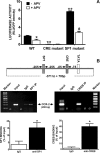
Burgeoning evidence supports a role for cyclooxygenase metabolites in regulating membrane excitability in various forms of synaptic plasticity. Two cyclooxygenases, COX-1 and COX-2, catalyze the initial step in the metabolism of arachidonic acid to prostaglandins. COX-2 is generally considered inducible, but in glutamatergic neurons in some brain regions, including the cerebral cortex, it is constitutively expressed. However, the transcriptional mechanisms by which this occurs have not been elucidated. Here, we used quantitative PCR and also analyzed reporter gene expression in a mouse line carrying a construct consisting of a portion of the proximal promoter region of the mouse COX-2 gene upstream of luciferase cDNA to characterize COX-2 basal transcriptional regulation in cortical neurons. Extracts from the whole brain and from the cerebral cortex, hippocampus, and olfactory bulbs exhibited high luciferase activity. Moreover, constitutive COX-2 expression and luciferase activity were detected in cortical neurons, but not in cortical astrocytes, cultured from wild-type and transgenic mice, respectively. Constitutive COX-2 expression depended on spontaneous but not evoked excitatory synaptic activity and was shown to be N-methyl-d-aspartate receptor-dependent. Constitutive promoter activity was reduced in neurons transfected with a dominant-negative cAMP response element binding protein (CREB) and was eliminated by mutating the CRE-binding site on the COX-2 promoter. However, mutation of the stimulatory protein-1 (Sp1)-binding site resulted in an N-methyl-d-aspartate receptor-dependent enhancement of COX-2 promoter activity. Basal binding of the transcription factors CREB and Sp1 to the native neuronal COX-2 promoter was confirmed. In toto, our data suggest that spontaneous glutamatergic synaptic activity regulates constitutive neuronal COX-2 expression via Sp1 and CREB protein-dependent transcriptional mechanisms.
Keywords: N-methyl-d-aspartate receptor (NMDA receptor, NMDAR); cAMP response element-binding protein (CREB); constitutive expression; cyclooxygenase (COX); neuron; specificity protein 1 (Sp1); transcription; transcriptional regulation.
© 2016 by The American Society for Biochemistry and Molecular Biology, Inc.
Figures


Similar articles
-
Activated cAMP-response element-binding protein regulates neuronal expression of presenilin-1.J Biol Chem. 2001 Mar 30;276(13):9688-98. doi: 10.1074/jbc.M006153200. Epub 2000 Dec 14. J Biol Chem. 2001. PMID: 11116137
-
Identification of a prostaglandin-responsive element in the Na,K-ATPase beta 1 promoter that is regulated by cAMP and Ca2+. Evidence for an interactive role of cAMP regulatory element-binding protein and Sp1.J Biol Chem. 2005 Jan 7;280(1):334-46. doi: 10.1074/jbc.M411415200. Epub 2004 Oct 14. J Biol Chem. 2005. PMID: 15485816
-
Mechanism of prostaglandin E2-induced transcriptional up-regulation of Oncostatin-M by CREB and Sp1.Biochem J. 2018 Jan 31;475(2):477-494. doi: 10.1042/BCJ20170545. Biochem J. 2018. PMID: 29269396
-
Genetic approaches to investigate the role of CREB in neuronal plasticity and memory.Mol Neurobiol. 2011 Dec;44(3):330-49. doi: 10.1007/s12035-011-8209-x. Epub 2011 Sep 23. Mol Neurobiol. 2011. PMID: 21948060 Review.
-
Function and regulation of CREB family transcription factors in the nervous system.Neuron. 2002 Aug 15;35(4):605-23. doi: 10.1016/s0896-6273(02)00828-0. Neuron. 2002. PMID: 12194863 Review.
Cited by
-
Influence of Cyclooxygenase-2 Inhibitors on Kynurenic Acid Production in Rat Brain in Vitro.Neurotox Res. 2019 Jan;35(1):244-254. doi: 10.1007/s12640-018-9952-9. Epub 2018 Sep 3. Neurotox Res. 2019. PMID: 30178287 Free PMC article.
-
Postnatal changes in constitutive cyclooxygenase‑2 expression in the mice hippocampus and its function in synaptic plasticity.Mol Med Rep. 2019 Mar;19(3):1996-2004. doi: 10.3892/mmr.2019.9867. Epub 2019 Jan 15. Mol Med Rep. 2019. PMID: 30664214 Free PMC article.
-
Transcriptional Activation, Deactivation and Rebound Patterns in Cortex, Hippocampus and Amygdala in Response to Ketamine Infusion in Rats.Front Mol Neurosci. 2022 May 30;15:892345. doi: 10.3389/fnmol.2022.892345. eCollection 2022. Front Mol Neurosci. 2022. PMID: 35706427 Free PMC article.
-
Epstein-Barr Virus dUTPase Induces Neuroinflammatory Mediators: Implications for Myalgic Encephalomyelitis/Chronic Fatigue Syndrome.Clin Ther. 2019 May;41(5):848-863. doi: 10.1016/j.clinthera.2019.04.009. Epub 2019 Apr 28. Clin Ther. 2019. PMID: 31040055 Free PMC article.
-
Maintenance of the Innate Seizure Threshold by Cyclooxygenase-2 is Not Influenced by the Translational Silencer, T-cell Intracellular Antigen-1.Neuroscience. 2018 Mar 1;373:37-51. doi: 10.1016/j.neuroscience.2018.01.004. Epub 2018 Jan 11. Neuroscience. 2018. PMID: 29337236 Free PMC article.
References
-
- Vane J. R., Bakhle Y. S., and Botting R. M. (1998) Cyclooxygenases 1 and 2. Annu. Rev. Pharmacol. Toxicol. 38, 97–120 - PubMed
-
- Bhattacharyya D. K., Lecomte M., Dunn J., Morgans D. J., and Smith W. L. (1995) Selective inhibition of prostaglandin endoperoxide synthase-1 (cyclooxygenase-1) by valerylsalicylic acid. Arch. Biochem. Biophys. 317, 19–24 - PubMed
-
- Smith W. L., and Song I. (2002) The enzymology of prostaglandin endoperoxide H synthases-1 and -2. Prostaglandins Other Lipid Mediat. 68, 115–128 - PubMed
-
- Kraemer S. A., Meade E. A., and DeWitt D. L. (1992) Prostaglandin endoperoxide synthase gene structure: identification of the transcriptional start site and 5′-flanking regulatory sequences. Arch. Biochem. Biophys. 293, 391–400 - PubMed
-
- Wang L. H., Hajibeigi A., Xu X. M., Loose-Mitchell D., and Wu K. K. (1993) Characterization of the promoter of human prostaglandin H synthase-1 gene. Biochem. Biophys. Res. Commun. 190, 406–411 - PubMed
Publication types
MeSH terms
Substances
Grants and funding
LinkOut - more resources
Full Text Sources
Other Literature Sources
Research Materials

