. 2016 Dec 6;113(49):14097-14102.
doi: 10.1073/pnas.1617903113. Epub 2016 Nov 21.

The innate immune receptor Dectin-2 mediates the phagocytosis of cancer cells by Kupffer cells for the suppression of liver metastasis

Affiliations

The innate immune receptor Dectin-2 mediates the phagocytosis of cancer cells by Kupffer cells for the suppression of liver metastasis

Yoshitaka Kimura et al. Proc Natl Acad Sci U S A. .

Abstract

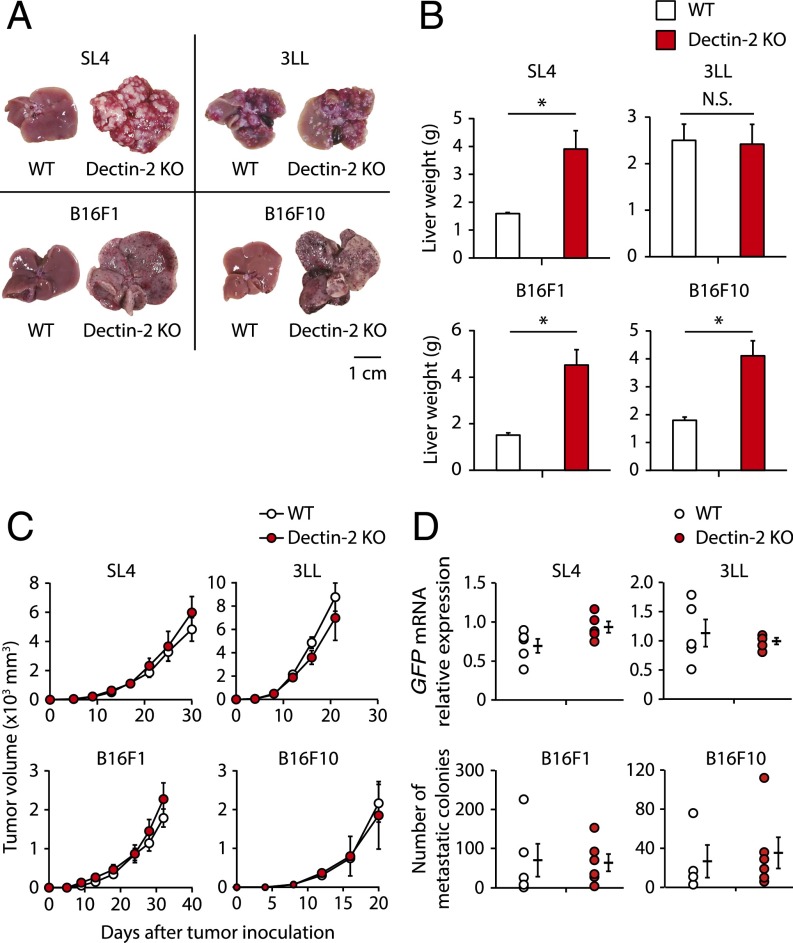
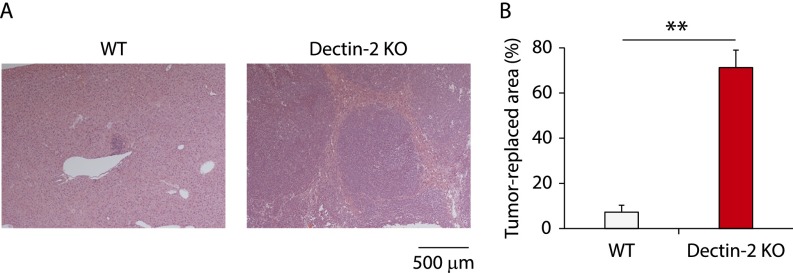
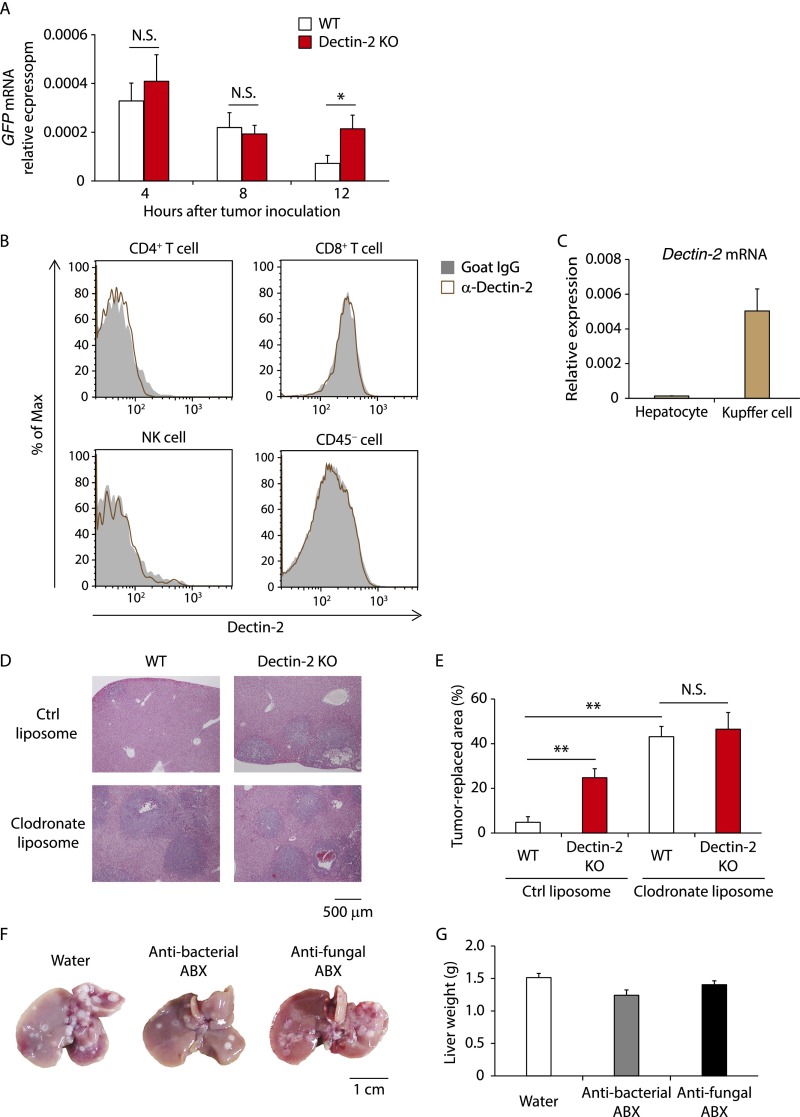
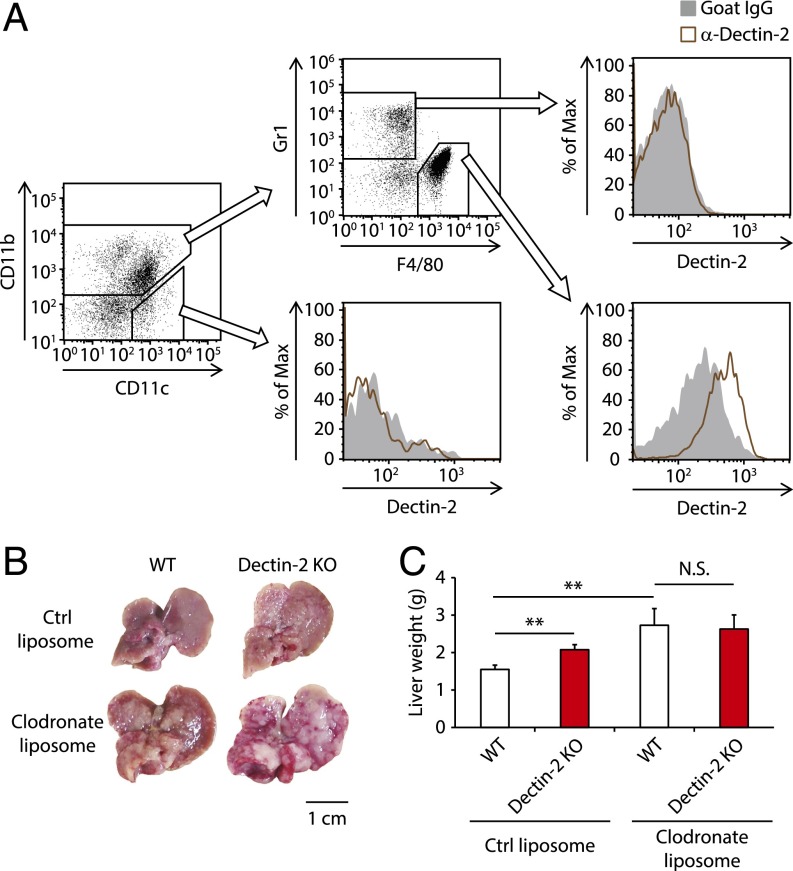
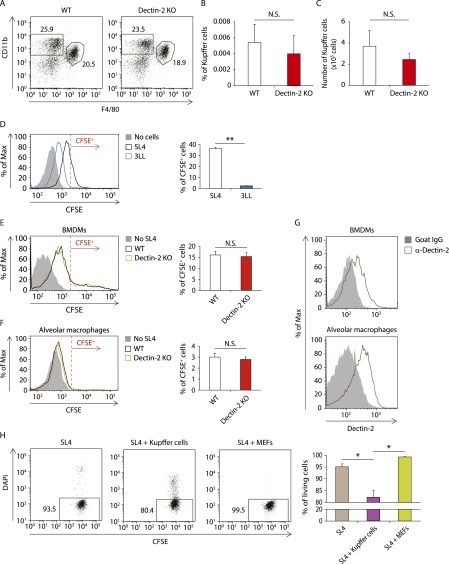
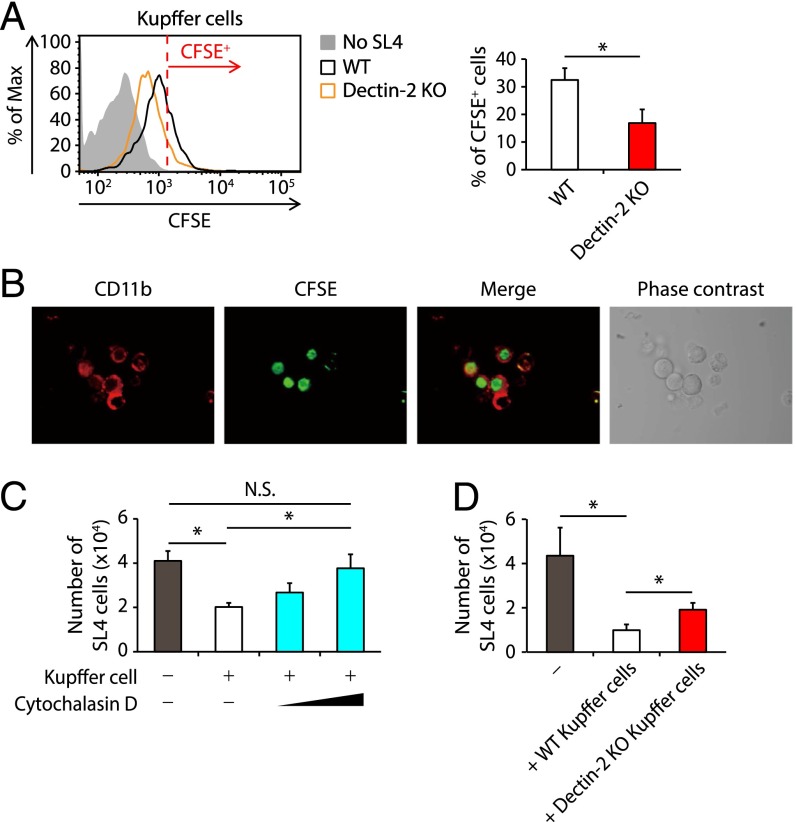
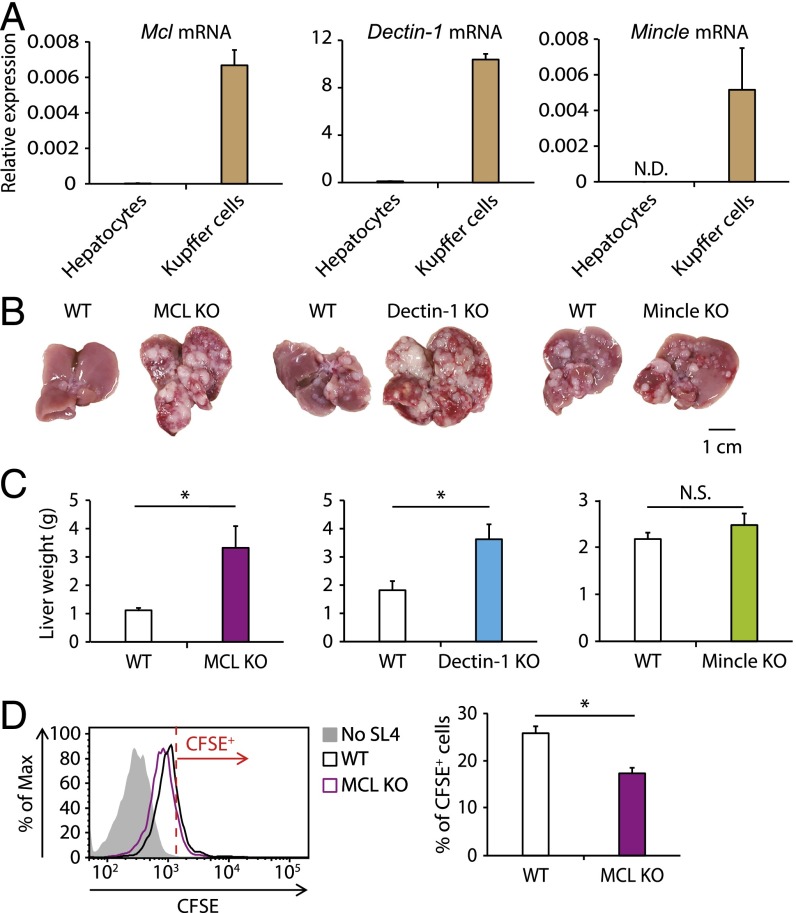
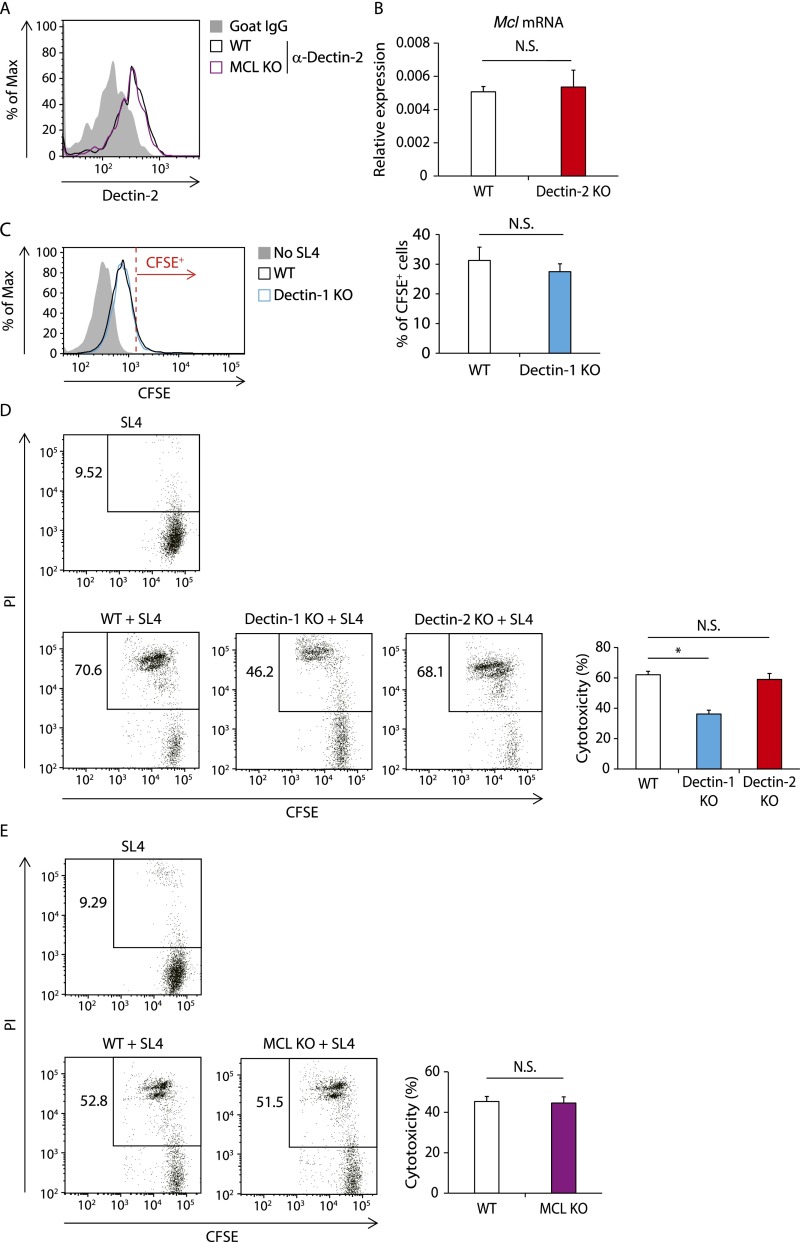
Tumor metastasis is the cause of most cancer deaths. Although metastases can form in multiple end organs, the liver is recognized as a highly permissive organ. Nevertheless, there is evidence for immune cell-mediated mechanisms that function to suppress liver metastasis by certain tumors, although the underlying mechanisms for the suppression of metastasis remain elusive. Here, we show that Dectin-2, a C-type lectin receptor (CLR) family of innate receptors, is critical for the suppression of liver metastasis of cancer cells. We provide evidence that Dectin-2 functions in resident macrophages in the liver, known as Kupffer cells, to mediate the uptake and clearance of cancer cells. Interestingly, Kupffer cells are selectively endowed with Dectin-2-dependent phagocytotic activity, with neither bone marrow-derived macrophages nor alveolar macrophages showing this potential. Concordantly, subcutaneous primary tumor growth and lung metastasis are not affected by the absence of Dectin-2. In addition, macrophage C-type lectin, a CLR known to be complex with Dectin-2, also contributes to the suppression of liver metastasis. Collectively, these results highlight the hitherto poorly understood mechanism of Kupffer cell-mediated control of metastasis that is mediated by the CLR innate receptor family, with implications for the development of anticancer therapy targeting CLRs.

Keywords: C-type lectin receptor; Dectin-2; Kupffer cell; liver metastasis; phagocytosis.


Conflict of interest statement

The authors declare no conflict of interest.

Figures

Fig. 1.
Fig. 1.
Selective contribution of Dectin-2 to the suppression of liver metastasis. (A and B) SL4 cells (2 × 10⁵ cells), 3LL cells (3 × 10⁵ cells), B16F1 cells (1 × 10⁶ cells), or B16F10 cells (2 × 10⁵ cells) were inoculated into the spleens of WT and Dectin-2 KO mice. Fourteen days later, the livers were observed macroscopically (A) and liver weights were measured (B). (Scale bar: 1 cm.) (C) SL4 cells (2 × 10⁵ cells), 3LL cells (5 × 10⁵ cells), B16F1 cells (5 × 10⁵ cells), or B16F10 cells (1 × 10⁵ cells) were inoculated s.c. into WT and Dectin-2 KO mice, and tumor volumes were measured every 3 or 4 d. (D) SL4-GFP cells (3 × 10⁵ cells), 3LL-GFP cells (1 × 10⁶ cells), B16F1 cells (1 × 10⁶ cells), or B16F10 cells (5 × 10⁵ cells) were inoculated i.v. into WT and Dectin-2 KO mice, and the metastatic levels of SL4-GFP and 3LL-GFP cells were evaluated by quantifying GFP mRNA in the lung on day 12. The numbers of B16F1 and B16F10 colonies in the lung were counted at 14 d after inoculation. Data are shown as mean ± SEM. *P < 0.05. N.S., not significant.
Fig. S1.
Fig. S1.
Histological analysis for Dectin-2–mediated suppression of liver metastasis. At 14 d after WT and Dectin-2 KO mice were inoculated intrasplenically with SL4 cells (2 × 10⁵ cells), liver sections were analyzed by H&E staining. Representative staining images (A) and tumor-replaced areas (B) are shown. (Scale bar: 500 μm.) Data are displayed as mean ± SEM. **P < 0.01.
Fig. S2.
Fig. S2.
Critical role of Dectin-2–expressing Kupffer cells in cancer rejection at the liver. (A) SL4-GFP cells (2 × 10⁵ cells) were inoculated into the spleen of WT and Dectin-2 KO mice. GFP mRNA levels in the livers were quantified at the indicated time points. (B) Dectin-2 expression on liver-residing cells was analyzed by flow cytometry. Representative histograms gated with NK cells (CD45+ NK1.1+ CD3ε cells), CD4+ T cells (CD45+ NK1.1 CD3ε+ CD4+ cells), CD8+ T cells (CD45+ NK1.1 CD3ε+ CD8+ cells), and CD45 cells are shown. (C) Dectin-2 mRNA expression levels in isolated hepatocytes and Kupffer cells were measured by qRT-PCR. (D and E) WT and Dectin-2 KO mice were treated with control (ctrl) liposomes or clodronate liposomes on days −2 and 2 of intrasplenic inoculation of SL4 cells (2 × 10⁵ cells). On day 10, liver sections were analyzed histologically with H&E staining. Representative staining images (D) and tumor-replaced areas (E) are shown. (Scale bar: 500 μm.) (F and G) Mice were treated with or without an antibacterial or antifungal antibiotic mixture via drinking water for 3 wk. SL4 cells (2 × 10⁵ cells) were inoculated intrasplenically into the mice, and 14 d later, liver metastases were evaluated by macroscopic observation (F) and liver weights (G). The antibiotic treatments were continued until the livers were collected. (Scale bar: 1 cm.) Data are shown as mean ± SEM. *P < 0.05; **P < 0.01. N.S., not significant.
Fig. 2.
Fig. 2.
Requirement of Kupffer cells for the Dectin-2–mediated antitumor system against liver metastasis. (A) Dectin-2 expression on liver-residing cells was analyzed with flow cytometry. Plots gated on CD45+ cells are shown. (B and C) WT and Dectin-2 KO mice were treated with control (ctrl) liposomes or clodronate liposomes 2 d before and after intrasplenic inoculation of SL4 cells (2 × 10⁵ cells). On day 10, the livers were collected. Macroscopic images of the liver (B) and liver weights (C) are shown. (Scale bar: 1 cm.) Data are displayed as mean ± SEM. **P < 0.01. N.S., not significant.
Fig. S3.
Fig. S3.
The role of Dectin-2 in Kupffer cell differentiation and phagocytosis against cancer cells. (A–C) The composition of liver-residing cells in WT and Dectin-2 KO mice was analyzed by flow cytometry. (A) Representative plots gated with CD45+ cells. (B and C) The proportion (B) and number (C) of CD45+ CD11b+ F4/80+ Kupffer cells. (D) Kupffer cells (1 × 10⁵ cells) were cocultured with or without CFSE-labeled SL4 cells or 3LL cells (0.25 × 10⁵ cells) for 2 h, and the CFSE intensity in CD45+ CD11b+ F4/80+ cells was analyzed by flow cytometry. (Left) Representative histograms of CFSE level. Cells with a CFSE level exceeding the red line are identified as CFSE+ cells. (Right) Proportion of CFSE+ cells. The experiments were performed three times, with high reproducibility. (E and F) BMDMs (1 × 10⁵ cells) (E) or alveolar macrophages (1 × 10⁵ cells) (F) isolated from WT and Dectin-2 KO mice were cocultured with or without CFSE-labeled SL4 cells (0.25 × 10⁵ cells) for 2 h. The CFSE intensity in CD45+ CD11b+ F4/80+ cells (E) or CD45+ CD11c+ F4/80+ cells (F) was analyzed by flow cytometry. (Left) Representative histograms of CFSE level. Cells with a CFSE level exceeding the red line are identified as CFSE+ cells. (Right) Proportion of CFSE+ cells. (G) Dectin-2 expression on BMDMs and alveolar macrophages were analyzed by flow cytometry. Representative histograms are shown. (H) CFSE-labeled SL4 cells (0.25 × 10⁵ cells) were cocultured with Kupffer cells (1 × 10⁵ cells) or MEF-mCherry cells (1 × 10⁵ cells) for 12 h. The proportion of DAPI cells among the CD11b CFSE+ cells or mCherry CFSE+ cells was analyzed by flow cytometry when SL4 cells were cultured in the presence of Kupffer cells or MEF-mCherry cells, respectively. Representative plots are shown. Data are shown as mean ± SEM. *P < 0.05; **P < 0.01. N.S., not significant.
Fig. 3.
Fig. 3.
Dectin-2–dependent engulfment and clearance of cancer cells by Kupffer cells. (A) Kupffer cells (1 × 10⁵ cells) isolated from WT and Dectin-2 KO mice were cocultured with or without CFSE-labeled SL4 cells (0.25 × 10⁵ cells) for 2 h. The CFSE intensity in CD45+ CD11b+ F4/80+ cells was analyzed by flow cytometry. (Left) Representative histograms of CFSE level. The cells with a CFSE level exceeding the red line were identified as CFSE+ cells. (Right) Proportion of CFSE+ cells. (B) Kupffer cells (1 × 10⁵ cells) were cocultured with CFSE-labeled SL4 cells (0.25 × 10⁵ cells) and after 2 h, the cells were observed by confocal microscopy. (C) CFSE-labeled SL4 cells (0.25 × 10⁵ cells) were cultured in the presence or absence of Kupffer cells (1 × 10⁵ cells) pretreated with DMSO or cytochalasin D, and the number of PI CD45 CFSE+ cells was determined at 24 h after culturing. (D) CFSE-labeled SL4 cells (0.25 × 10⁵ cells) were cultured in the presence or absence of Kupffer cells (1 × 10⁵ cells) derived from WT and Dectin-2 KO mice, and the number of PI CD45 CFSE+ cells was determined at 24 h after culturing. Data are shown as mean ± SEM. *P < 0.05. N.S., not significant.
Fig. S4.
Fig. S4.
Analysis of cancer cell recognition by Dectin-2 and Dectin-2–mediated gene induction in response to cancer cells. (A) Binding of sDectin-2 to SL4 cells and zymosan particles was analyzed by flow cytometry. Representative histograms are shown. (B) Kupffer cells (1 × 10⁵ cells) isolated from WT and Dectin-2 KO mice were cocultured with or without 0.25 × 10⁵ CFSE-labeled SL4 cells pretreated with N-glycosidase or a combination of O-glycosidase and neuraminidase (10), and 2 h later, CFSE intensity in CD45+ CD11b+ F4/80+ cells was analyzed by flow cytometry. Representative histograms of CFSE levels and proportion of CFSE+ cells are shown. (C) Kupffer cells (1 × 10⁵ cells) and SL4 cells (1 × 10⁵ cells) were cultured together or separately, and mRNA levels of Il6, Il23a, Cxcl1, and Ccl2 at the indicated time points were quantified by qRT-PCR analysis. (D and E) Kupffer cells (1 × 10⁵ cells) were isolated from WT and Dectin-2 KO mice and cultured together with or separately from SL4 cells (1 × 10⁵ cells). Eight hours later, mRNA expression levels of Il6, Il23a, Cxcl1, and Ccl2 (D) or Tnf, Arg1, and Cd206 (E) were analyzed by qRT-PCR. Data are shown as mean ± SEM. *P < 0.05; **P < 0.01. N.S., not significant.
Fig. 4.
Fig. 4.
MCL-mediated uptake of cancer cells by Kupffer cells and suppression of liver metastasis. (A) Expression levels of Mcl, Dectin-1, and Mincle mRNAs in hepatocytes and Kupffer cells were analyzed by qRT-PCR. (B and C) SL4 cells (2 × 10⁵ cells) were inoculated into the spleens of WT, MCL KO, Dectin-1 KO, and Mincle KO mice. On day 14, macroscopic images of livers were obtained (B), and livers were weighed (C). (Scale bar: 1 cm.) (D) Kupffer cells collected from WT and MCL KO mice were cocultured with or without CFSE-labeled SL4 cells (0.25 × 10⁵ cells) for 2 h. The CFSE intensity in CD45+ CD11b+ F4/80+ cells was analyzed by flow cytometry. (Left) Representative histograms of CFSE levels. Cells with a CFSE level exceeding the red line were identified as CFSE+ cells. (Right) Proportion of CFSE+ cells. Data are displayed as mean ± SEM. *P < 0.05. N.S., not significant; N.D., not detected.
Fig. S5.
Fig. S5.
The roles of MCL and Dectin-1 in the regulation of Dectin-2 expression, phagocytotic activity of Kupffer cells, and cytotoxic activity of liver NPCs against cancer cells. (A) Dectin-2 expression on Kupffer cells isolated from WT and MCL KO mice were analyzed by flow cytometry. Representative histograms are shown. (B) Mcl mRNA expression levels in Kupffer cells isolated from WT and Dectin-2 KO mice were measured with qRT-PCR analysis. (C) Kupffer cells collected from WT and Dectin-1 KO mice were cocultured with or without CFSE-labeled SL4 cells (0.25 × 10⁵ cells) for 2 h. The CFSE intensity in CD45+ CD11b+ F4/80+ cells was analyzed by flow cytometry. (Left) Representative histograms of CFSE level. Cells with a CFSE level exceeding the red line are identified as CFSE+ cells. (Right) Proportion of CFSE+ cells. (D and E) CFSE-labeled SL4 cells (1 × 10⁵ cells) were cocultured with or without liver NPCs (5 × 10⁶ cells) derived from WT, Dectin-1 KO, and Dectin-2 KO mice (D) or from WT and MCL KO mice (E). The proportion of PI+ population in SL4 cells was analyzed by flow cytometry at 4 h after the coculture. (Left) Representative plots gated with CD45 CFSE+ cells. (Right) Calculated cytotoxicity of SL4 cells. Data are displayed as mean ± SEM. *P < 0.05. N.S., not significant.

Similar articles

Cited by

References

    1. Valastyan S, Weinberg RA. Tumor metastasis: Molecular insights and evolving paradigms. Cell. 2011;147(2):275–292. - PMC - PubMed
    1. Manfredi S, et al. Epidemiology and management of liver metastases from colorectal cancer. Ann Surg. 2006;244(2):254–259. - PMC - PubMed
    1. Van den Eynden GG, et al. The multifaceted role of the microenvironment in liver metastasis: Biology and clinical implications. Cancer Res. 2013;73(7):2031–2043. - PubMed
    1. Protzer U, Maini MK, Knolle PA. Living in the liver: Hepatic infections. Nat Rev Immunol. 2012;12(3):201–213. - PubMed
    1. Heymann F, Tacke F. Immunology in the liver—from homeostasis to disease. Nat Rev Gastroenterol Hepatol. 2016;13(2):88–110. - PubMed

Publication types