. 2016 Dec 14;20(6):798-809.
doi: 10.1016/j.chom.2016.10.009. Epub 2016 Nov 17.

Histones Are Rapidly Loaded onto Unintegrated Retroviral DNAs Soon after Nuclear Entry

Affiliations

Histones Are Rapidly Loaded onto Unintegrated Retroviral DNAs Soon after Nuclear Entry

Gary Z Wang et al. Cell Host Microbe. .

Abstract

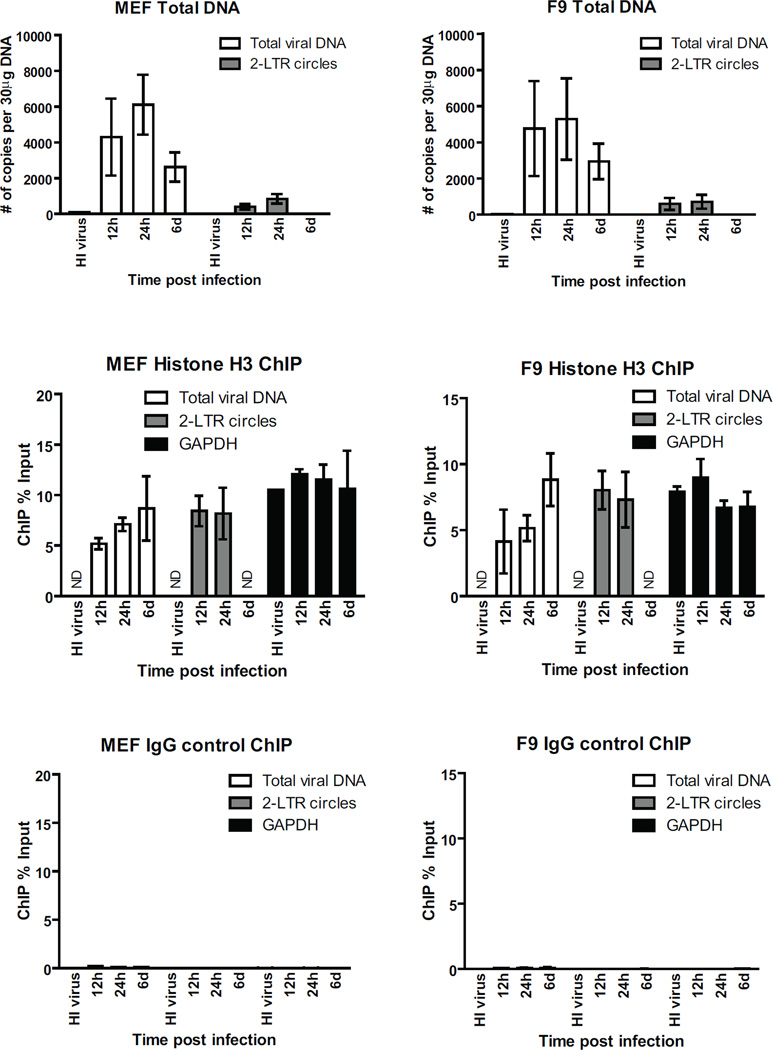
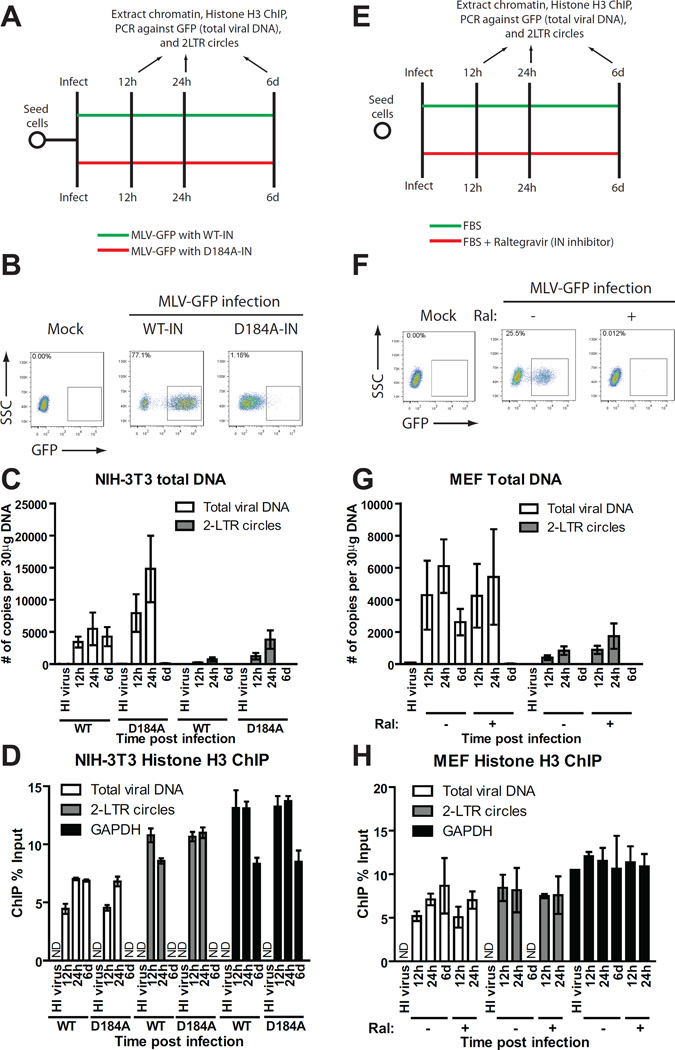
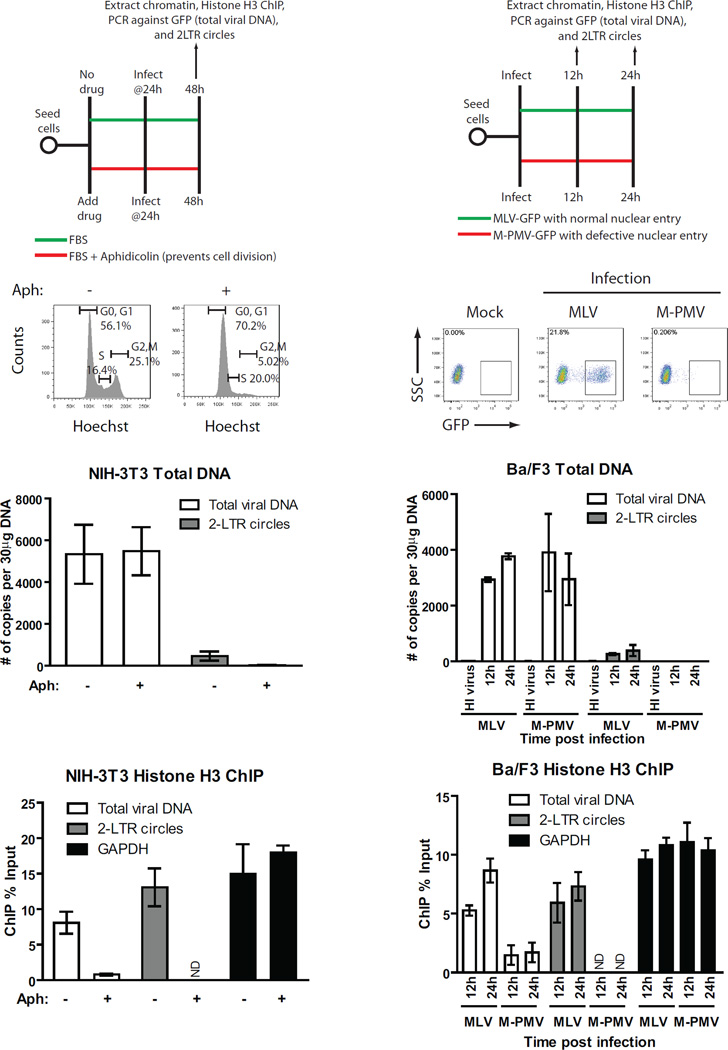
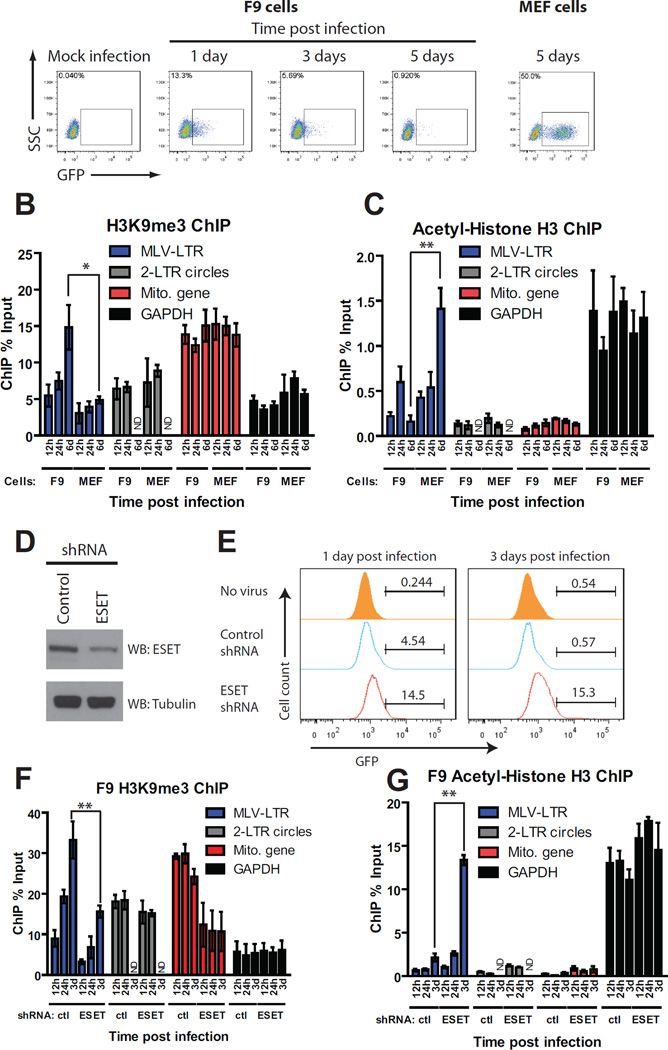
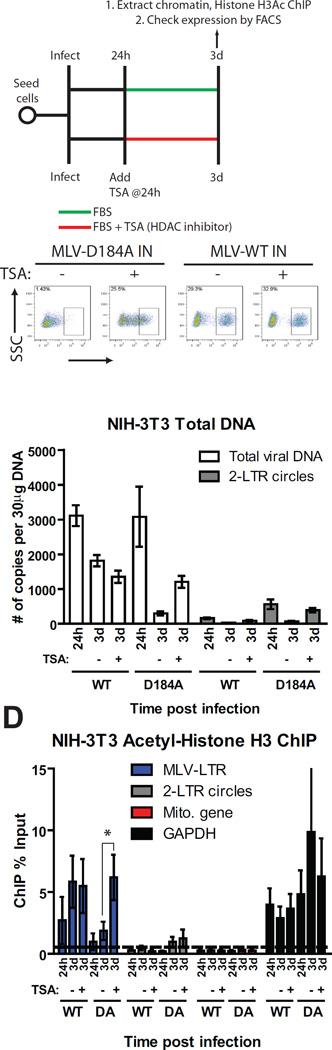
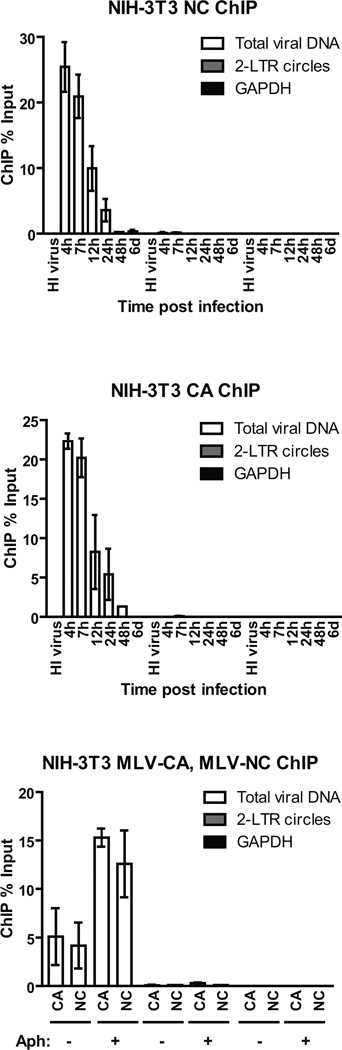
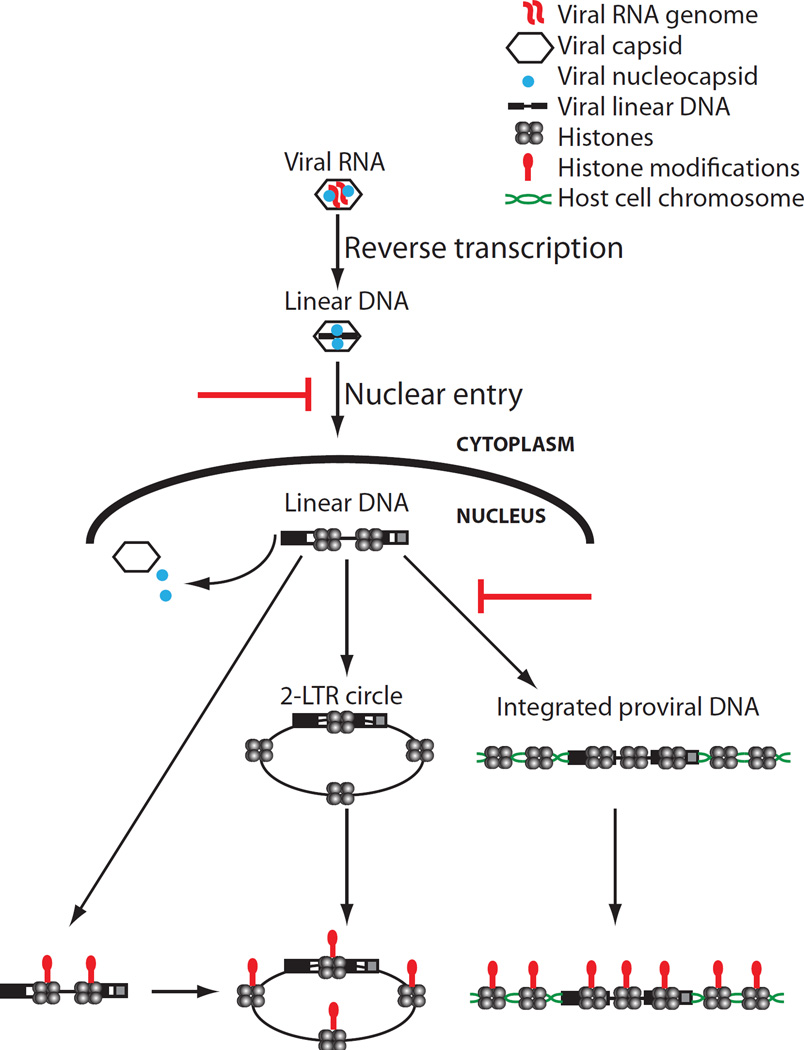
Chromosomal structure of nuclear DNA is usually maintained by insertion of nucleosomes into preexisting chromatin, both on newly synthesized DNA at replication forks and at sites of DNA damage. But during retrovirus infection, a histone-free DNA copy of the viral genome is synthesized that must be loaded with nucleosomes de novo. Here, we show that core histones are rapidly loaded onto unintegrated Moloney murine leukemia virus DNAs. Loading of nucleosomes requires nuclear entry, but does not require viral DNA integration. The histones associated with unintegrated DNAs become marked by covalent modifications, with a delay relative to the time of core histone loading. Expression from unintegrated DNA can be enhanced by modulation of the histone-modifying machinery. The data show that histone loading onto unintegrated DNAs occurs very rapidly after nuclear entry and does not require prior establishment of an integrated provirus.

Keywords: chromatin immunoprecipitation; epigenetics; histone; histone modifications; nucleosome; retrovirus.


Conflict of interest statement

The authors declare that they have no conflict of interest.

Figures

FIGURE 1
FIGURE 1. Core histone loading onto retroviral DNAs occur rapidly following infection
(A) MEF cells were infected with VSV-G pseudotyped MLV-GFP virus. To control for potential plasmid DNA carry over in the viral supernatant, heat inactivated (HI) virus were used in parallel. Total DNA from infected cells was isolated at indicated times, followed by real time quantitative PCR using primers targeting GFP (total viral DNA) and 2-LTR circles. Absolute copy number is calculated based on standard curves generated using plasmid DNA. Results shown are means ± SDs from two independent experiments performed in duplicate. For related data, see Figure S1. (B and C) ChIP analysis of chromatin harvested at indicated times following MLV-GFP infection of MEF cells using antibody to (B) histone H3 or (C) control rabbit IgG. ChIP data is presented as % of input DNA, calculated by dividing the ChIP copy number for each gene target by the copy number from input DNA and multiplying by 100%. Results shown are means ± SDs from two independent experiments performed in duplicate. ND, not determined. For related data, see Figure S2. (D, E, F) Same as (A, B, C), respectively, using F9 embryonic carcinoma cells.
FIGURE 2
FIGURE 2. Histone loading of retroviral DNAs occurs independently of viral integration
(A) Schematic of experimental setup. (B) Flow cytometry analysis of NIH-3T3 cells infected with VSV-G pseudotyped WT or integrase defective mutant (D184A) MLV-GFP viruses at 2d post infection. SSC, side scatter. One of three independent experiments is shown. (C) NIH-3T3 cells were infected with VSV-G pseudotyped WT or integrase-defective mutant (D184A) MLV-GFP viruses. Total DNA from infected cells was isolated at indicated times post infection and number of copies of viral replication intermediates was determined (means ± SDs from two independent experiments performed in duplicate). (D) Histone H3 ChIP analysis of chromatin harvested at indicated times following MLV-GFP infection of NIH-3T3 cells. ChIP data is presented as % of input DNA (means ± SDs from two independent experiments performed in duplicate). (E) Schematic of experimental setup. (F) Flow cytometry analysis of MEF cells infected with VSV-G pseudotyped WT MLV-GFP viruses in the presence or absence of raltegravir (Ral). Results are from 2d post infection. One representative of three independent experiments is shown. (G) MEF cells were infected with VSV-G pseudotyped WT MLV-GFP viruses in the presence or absence of raltegravir (Ral). Total DNA from infected cells was isolated at indicated times post infection and the number of copies of viral replication intermediates was determined (means ± SDs from two independent experiments performed in duplicate). (H) Histone H3 ChIP analysis of chromatin harvested at indicated times following MLV-GFP infection of MEF cells treated with or without raltegravir (Ral). ChIP data is presented as % of input DNA (means ± SDs from two independent experiments performed in duplicate). ND, not determined.
FIGURE 3
FIGURE 3. Histone loading of retroviral DNAs requires viral nuclear entry
(A) Schematic of experimental setup. (B) Cell cycle analysis of NIH-3T3 cells treated with or without DNA polymerase inhibitor aphidicolin for 24h prior to infection. Y-axis, cell count, X-axis, DNA content measured by Hoechst staining. One representative of three independent experiments is shown. (C) NIH-3T3 cells pretreated with or without aphidicolin (Aph) to induce cell cycle arrest were infected with VSV-G pseudotyped WT MLV-GFP virus. Total DNA from infected cells was isolated 24h post infection and levels of viral replication intermediates were determined (means ± SDs from two independent experiments performed in duplicate). (D) Histone H3 ChIP analysis of chromatin harvested from NIH-3T3 cells outlined in (C) 24h post infection. ChIP data is presented as % of input DNA (means ± SDs from two independent experiments performed in duplicate). (E) Schematic of experimental setup. (F) Flow cytometry analysis of Ba/F3 cells infected with VSV-G pseudotyped single-round MLV or M-PMV-GFP viruses at 2d post infection. SSC, side scatter. One representative of three independent experiments is shown. (G) Level of viral replication intermediates from Ba/F3 cells infected with MLV or M-PMV-GFP viruses. Total DNA from infected cells was isolated at indicated times post infection and number of copies of viral replication intermediates was determined (means ± SDs from two independent experiments performed in duplicate). (H) Histone H3 ChIP analysis of chromatin harvested from infected Ba/F3 cells outlined in (G). ChIP data is presented as % of input DNA (means ± SDs from two independent experiments performed in duplicate). ND, not determined.
FIGURE 4
FIGURE 4. Loading of epigenetically modified histones onto viral DNAs is delayed compared to core histones
(A) Flow cytometry analysis of F9 or MEF cells infected with VSV-G pseudotyped WT MLV-GFP viruses at the indicated times. SSC, side scatter. One representative of three independent experiments is shown. (B) H3K9 trimethylation (H3K9me3) ChIP analysis of infected F9 and MEF cells at the indicated times. ChIP data is presented as % of input DNA (means ± SEMs from three independent experiments performed in duplicate). Mito gene, mitochondrial RNA polymerase (positive control), GAPDH (negative control). *, p < 0.05. (C) Acetyl-histone H3 (H3Ac) ChIP analysis of infected F9 or MEF cells at the indicated times. ChIP data is presented as % of input DNA (means ± SEMs from three independent experiments performed in duplicate). Mito gene (negative control) and GAPDH (positive control) are shown. **, p < 0.01. (D) Total cell lysates prepared from F9 control knockdown (KD) and F9 ESET KD cells were immunoblotted with antisera as indicated. (E) Flow cytometry analysis of F9 control or ESET KD cells infected with VSV-G pseudotyped WT MLV-GFP viruses at the indicated times. Y-axis shows cell count, X-axis shows GFP intensity. One representative example of two independent experiments is shown. (F and G) Similar experiments as (B and C), respectively, using MLV infected F9 control or ESET KD cells (means ± SEMs from three independent experiments performed in duplicate). **, p < 0.01. For related data, see Figure S3. Student’s t-test was used for statistical analysis. ND, not determined.
FIGURE 5
FIGURE 5. Characterization of the expression of unintegrated MLV DNA in NIH-3T3 cells
(A) Schematic of experimental setup. (B) Flow cytometry analysis of NIH-3T3 cells infected with VSV-G pseudotyped WT or integrase defective mutant (D184A) MLV-GFP viruses with or without TSA. Results are from 2d post TSA treatment. SSC, side scatter. One representative of three independent experiments is shown. (C) NIH-3T3 cells infected with VSV-G pseudotyped WT or integrase defective mutant (D184A) MLV-GFP virus with or without TSA. Total DNA was isolated at indicated times and levels of viral replication intermediates were determined (means ± SEMs from three independent experiments performed in duplicate). (D) H3Ac ChIP analysis of infected NIH-3T3 cells with or without TSA. ChIP data is presented as % of input DNA (means ± SEMs from three independent experiments performed in duplicate). Student’s t-test was used for statistical analysis. *, p < 0.05. ND, not determined.
FIGURE 6
FIGURE 6. Characterization of the kinetics of NC and CA association with viral DNA following reverse transcription
(A, B) ChIP analysis of chromatin harvested at indicated times following MLV-GFP infection of NIH-3T3 cells using (A) MLV-NC or (B) MLV-CA antibodies. For related data, see Figures S4 and S5. (C) ChIP analysis of chromatin harvested from aphidicolin (Aph)-treated NIH-3T3 cells 24h post infection with MLV-NC and CA antibodies. ChIP data is presented as % of input DNA (means ± SDs from two independent experiments performed in duplicate).
FIGURE 7
FIGURE 7
Model of the states of retroviral DNA following infection.

Comment in

Similar articles

Cited by

References

    1. Akgun E, Ziegler M, Grez M. Determinants of retrovirus gene expression in embryonal carcinoma cells. J Virol. 1991;65:382–388. - PMC - PubMed
    1. Annunziato AT. Assembling chromatin: the long and winding road. Biochim Biophys Acta. 2013;1819:196–210. - PubMed
    1. Banasik MB, McCray PB., Jr Integrase-defective lentiviral vectors: progress and applications. Gene Ther. 2010;17:150–157. - PubMed
    1. Beck-Engeser GB, Eilat D, Harrer T, Jack HM, Wabl M. Early onset of autoimmune disease by the retroviral integrase inhibitor raltegravir. Proc Natl Acad Sci U S A. 2009;106:20865–20870. - PMC - PubMed
    1. Brown PO, Bowerman B, Varmus HE, Bishop JM. Retroviral integration: structure of the initial covalent product and its precursor, and a role for the viral IN protein. Proc Natl Acad Sci U S A. 1989;86:2525–2529. - PMC - PubMed

LinkOut - more resources