. 2017 Jan 3;91(2):e02001-16.
doi: 10.1128/JVI.02001-16. Print 2017 Jan 15.

Mutations Inactivating Herpes Simplex Virus 1 MicroRNA miR-H2 Do Not Detectably Increase ICP0 Gene Expression in Infected Cultured Cells or Mouse Trigeminal Ganglia

Affiliations

Mutations Inactivating Herpes Simplex Virus 1 MicroRNA miR-H2 Do Not Detectably Increase ICP0 Gene Expression in Infected Cultured Cells or Mouse Trigeminal Ganglia

Dongli Pan et al. J Virol. .

Abstract

Herpes simplex virus 1 (HSV-1) latency entails the repression of productive ("lytic") gene expression. An attractive hypothesis to explain some of this repression involves inhibition of the expression of ICP0, a lytic gene activator, by a viral microRNA, miR-H2, which is completely complementary to ICP0 mRNA. To test this hypothesis, we engineered mutations that disrupt miR-H2 without affecting ICP0 in HSV-1. The mutant virus exhibited drastically reduced expression of miR-H2 but showed wild-type levels of infectious virus production and no increase in ICP0 expression in lytically infected cells, which is consistent with the weak expression of miR-H2 relative to the level of ICP0 mRNA in that setting. Following corneal inoculation of mice, the mutant was not significantly different from wild-type virus in terms of infectious virus production in the trigeminal ganglia during acute infection, mouse mortality, or the rate of reactivation from explanted latently infected ganglia. Critically, the mutant was indistinguishable from wild-type virus for the expression of ICP0 and other lytic genes in acutely and latently infected mouse trigeminal ganglia. The latter result may be related to miR-H2 being less effective in inhibiting ICP0 expression in transfection assays than a host microRNA, miR-138, which has previously been shown to inhibit lytic gene expression in infected ganglia by targeting ICP0 mRNA. Additionally, transfected miR-138 reduced lytic gene expression in infected cells more effectively than miR-H2. While this study provides little support for the hypothesis that miR-H2 promotes latency by inhibiting ICP0 expression, the possibility remains that miR-H2 might target other genes during latency.

Importance: Herpes simplex virus 1 (HSV-1), which causes a variety of diseases, can establish lifelong latent infections from which virus can reactivate to cause recurrent disease. Latency is the most biologically interesting and clinically vexing feature of the virus. Ever since miR-H2's discovery as a viral microRNA bearing complete sequence complementarity to the mRNA for the important viral gene activator ICP0, inhibition of ICP0 expression by miR-H2 has been a major hypothesis to help explain the repression of lytic gene expression during latency. However, this hypothesis remained untested in latently infected animals. Using a miR-H2-deficient mutant virus, we found no evidence that miR-H2 represses the expression of ICP0 or other lytic genes in cells or mice infected with HSV-1. Although miR-H2 can repress ICP0 expression in transfection assays, such repression is weak. The results suggest that other mechanisms for miR-H2 activity and for the repression of lytic gene expression during latency deserve investigation.

Keywords: herpes simplex virus; latency; miRNA.


Figures

FIG 1
FIG 1
Effects of miR-H2 on ICP0 protein and ICP0 mRNA expression in transfected cells. (A) 293T cells were cotransfected with 75 ng of pRS-1 and 16 nM either irrelevant control mimic or miR-H2 mimic. At 30 h posttransfection (hpt), ICP0 and, as a loading control, actin levels were analyzed by Western blotting. (B) 293T cells were cotransfected with pRS-1, 8 nM miR-H2 mimic, and 20 nM either miR-H2 inhibitor (antiH2) or control inhibitor (antiCtrl). At 30 hpt, ICP0 and actin levels were analyzed by Western blotting. (C) Transfection was performed as described in the legend to panel A in triplicate, with ICP0 mRNA levels, normalized to the levels of human GAPDH mRNA, measured by qRT-PCR at 30 hpt. Horizontal bars and error bars represent mean values and standard deviations, respectively.
FIG 2
FIG 2
miR-H2 mutations that do not affect ICP0 expression. (A) Mutations introduced into miR-H2. The top row shows the WT ICP0 gene sequence antisense to miR-H2, with the shaded area representing the sequence complementary to the seed region. The bottom row gives the corresponding mutant sequence with the altered nucleotides in bold letters. The middle row shows the predicted amino acid sequence encoded by both DNA sequences. (B) Sequence and hairpin structure of pre-miR-H2 showing mature miR-H2 in boldface, its seed region in boldface italics, and the base pairs that would be disrupted by the MH2 mutations in rectangles. (C) (Top) HEK293T wild-type and NoDice cells were either mock transfected (m) or transfected with the ICP0-expressing plasmid pRS-1 or the corresponding plasmid containing the miR-H2 mutations, pRS-1MH2. Protein samples were harvested at 24 hpt and serially diluted in twofold steps. Western blot analysis was conducted to compare the ICP0 protein levels in the different samples with the level of actin as an internal control. (Bottom) Total RNA samples were prepared at 24 hpt and analyzed for ICP0 mRNA levels by qRT-PCR. Horizontal bars and error bars represent mean values and standard deviations of the means, respectively, for three independent experiments. Differences were not statistically significant in either cell type (paired Student's t test). (D) 293T or NoDice cells were either mock transfected (M), or transfected with pRS-1 or pRS-1MH2 as indicated. At 24 hpt, <200-nucleotide RNA was isolated from transfected cells and analyzed by Northern blot hybridization, first being probed for miR-H2 and then stripped and probed with the U6 snRNA probe as an internal loading control.
FIG 3
FIG 3
Mutant HSV-1 with drastically reduced miR-H2 expression. (A) 293T cells were either mock infected or infected with WT (WT-BAC) or MH2 virus at an MOI of 10 for 18 h, followed by Northern blotting. The probes used for hybridization are shown to the left, and the positions of miRNA species (pre- and mature) are indicated to the right. (B) “miR-MH2” expressed in MH2-infected cells is present at levels 150-fold below the level of miR-H2 in WT-infected cells. qRT-PCR assays for miR-H2 (circles) and “miR-MH2” (squares) were performed on duplicate gel-extracted short RNA samples from 293T cells infected with WT (left) or MH2 (right) virus. Signals detected in WT-infected cells by the “miR-MH2” assay and in MH2-infected cells by the miR-H2 assay were either very low or not detectable (nd). Expression levels were normalized to that of host miRNA let-7a. Bars represent mean values.
FIG 4
FIG 4
The MH2 mutations have little effect on viral replication and ICP0 expression during lytic infection. (A) Replication kinetics in Vero cells at an MOI of 0.02 (left), in Neuro-2A cells at an MOI of 0.02 (middle) and in Neuro-2A cells at an MOI of 10 (right). Shown are viral titers over time. Each point represents the average value of triplicates. (B) Vero (left) or Neuro-2A (right) cells were infected with WT, MH2, or RH2 virus at an MOI of 10, followed by Western blotting for ICP0, ICP4, and actin levels. Viruses used for infection are indicated above each gel lane, and the infection times are shown on top. (C) Vero cells were infected with WT (black bar), MH2 (hatched bar), or RH2 (white bar) at an MOI of 10 for 3, 7, or 12 h, and then ICP0 (left) and ICP4 (right) transcript levels were measured by qRT-PCR. The error bars represent the standard deviations of duplicates. No difference was significant according to one-way ANOVA tests.
FIG 5
FIG 5
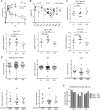
The MH2 mutations have little effect on viral replication and transcript levels in murine TGs. (A) Time course of miR-H2, LAT, and ICP0 mRNA expression in murine TGs. Mice were inoculated on the cornea with 2 × 10⁵ PFU of KOS per eye. At different dpi, 3 or 4 mice were euthanized and TGs were harvested and analyzed for ICP0 transcripts, stable LAT, and miR-H2 by qRT-PCR. RNA copy numbers were obtained by comparing the signals with standard curves generated using in vitro-transcribed ICP0 mRNA, LAT, or synthetic miR-H2. (B) Viral titers in TGs at 5 dpi following inoculation, with doses indicated at the top and virus names at the bottom. Data for different doses are separated by vertical dashed lines. Each point represents a value from one TG. The horizontal lines represent the geometric mean values (undetectable values were included in the calculations as 0). One-way ANOVA tests did not detect any significant differences between titers of viruses at each dose (P ≥ 0.16). (C to E) Mice were inoculated on the cornea with 2 × 10⁵ PFU/eye of the indicated virus. (C) Viral genome and transcript levels in TGs at 7 dpi. Each point represents a value from one TG. The names of the transcripts assayed are indicated at the top of each graph. Vertical axes show logarithmic values, and RNA levels were normalized to viral genome levels. The horizontal lines represent the geometric mean values. P values shown above the brackets were obtained by one-way ANOVA tests with Bonferroni's multiple comparison test. (D) Viral genome and transcript levels at 30 dpi as described in the legend to panel C, except that mean values are not indicated in the plots for viral lytic transcripts due to the large numbers of undetectable values. One-way ANOVA (for viral genome and LAT) and Kruskal-Wallis tests (for ICP0, tk, and gC transcripts) did not detect any significant differences (P ≥ 0.48). (E) Percentages of TGs exhibiting detectable lytic transcripts. Each vertical bar represents the value for each virus (indicated in the key) and each RNA (below the graph). Fisher's exact tests did not detect any significant differences for each transcript (P ≥ 0.34).
FIG 6
FIG 6
Viral virulence and reactivation from latency. Mice were corneally inoculated with 1 × 10⁴ PFU/eye of the indicated virus (n = 17 to 18 mice per virus group). The three viruses showed similar back titers of inocula, 1-dpi-eye-swab titers, and 3-dpi-TG titers (not shown). (A) Percentages of mice that died or were euthanized due to severe morbidity over time. Differences were not statistically significant (log-rank test, P > 0.1). (B) At 30 dpi, surviving mice were euthanized and their TGs were explanted onto a monolayer of Vero cells in tissue culture medium for induction of reactivation. Reactivation was assayed by the presence of infectious virus in the medium. Plotted are percentages of cultures (n = 22 to 28 per virus group) producing infectious virus at the indicated days after explantation (dpe). Differences were not statistically significant (log-rank test, P > 0.5).
FIG 7
FIG 7
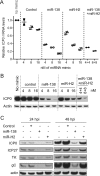
Weak repression by miR-H2. (A) 293T cells were cotransfected with 75 ng of pRS-1 together with the concentrations indicated on the x axis of an irrelevant control mimic or an miR-138 or miR-H2 mimic or both, as indicated above the graph. In the cells analyzed in the last two lanes, miR-138 and miR-H2 were both transfected. At 30 hpt, ICP0 and GAPDH mRNA levels were analyzed by qRT-PCR. Shown are ICP0 mRNA levels normalized by GAPDH mRNA levels, with the bars and error bars representing mean values and standard deviations of duplicates. (B) Transfection was performed as described in the legend to panel A. ICP0 and actin protein levels were analyzed by Western blotting. The mimics used and the concentrations are indicated above the gel images. (C) 293T cells were mock transfected or transfected with 16 nM irrelevant control mimic, miR-138 mimic, or miR-H2 mimic. At 24 hpt, the cells were infected with WT virus for 24 or 48 h at an MOI of 0.1. The cells were then harvested and analyzed for the different proteins listed on the left using Western blotting.

Similar articles

Cited by

References

    1. Roizman B, Knipe DM, Whitley RJ. 2013. Herpes simplex virus, p 1823–1897. In Knipe DM, Howley PM, Cohen JI, Griffin DE, Lamb RA, Martin MA, Racianello VR, Roizman B (ed), Fields virology, 6th ed Lippincott Williams & Wilkins, Philadelphia, PA.
    1. Stevens JG, Wagner EK, Devi-Rao GB, Cook ML, Feldman LT. 1987. RNA complementary to a herpesvirus alpha gene mRNA is prominent in latently infected neurons. Science 235:1056–1059. - PubMed
    1. Umbach JL, Kramer MF, Jurak I, Karnowski HW, Coen DM, Cullen BR. 2008. MicroRNAs expressed by herpes simplex virus 1 during latent infection regulate viral mRNAs. Nature 454:780–783. doi:10.1038/nature07103. - DOI - PMC - PubMed
    1. Jurak I, Kramer MF, Mellor JC, van Lint AL, Roth FP, Knipe DM, Coen DM. 2010. Numerous conserved and divergent microRNAs expressed by herpes simplex viruses 1 and 2. J Virol 84:4659–4672. doi:10.1128/JVI.02725-09. - DOI - PMC - PubMed
    1. Umbach JL, Nagel MA, Cohrs RJ, Gilden DH, Cullen BR. 2009. Analysis of human alphaherpesvirus microRNA expression in latently infected human trigeminal ganglia. J Virol 83:10677–10683. doi:10.1128/JVI.01185-09. - DOI - PMC - PubMed

MeSH terms

LinkOut - more resources