. 2016 Dec 30;291(53):27252-27264.
doi: 10.1074/jbc.M116.738989. Epub 2016 Nov 11.

Stress Granule Induction after Brain Ischemia Is Independent of Eukaryotic Translation Initiation Factor (eIF) 2α Phosphorylation and Is Correlated with a Decrease in eIF4B and eIF4E Proteins

Affiliations

Stress Granule Induction after Brain Ischemia Is Independent of Eukaryotic Translation Initiation Factor (eIF) 2α Phosphorylation and Is Correlated with a Decrease in eIF4B and eIF4E Proteins

María I Ayuso et al. J Biol Chem. .

Abstract

Stress granules (SGs) are cytoplasmic ribonucleoprotein aggregates that are directly connected with the translation initiation arrest response to cellular stresses. Translation inhibition (TI) is observed in transient brain ischemia, a condition that induces persistent TI even after reperfusion, i.e. when blood flow is restored, and causes delayed neuronal death (DND) in selective vulnerable regions. We previously described a connection between TI and DND in the hippocampal cornu ammonis 1 (CA1) in an animal model of transient brain ischemia. To link the formation of SGs to TI and DND after brain ischemia, we investigated SG induction in brain regions with differential vulnerabilities to ischemia-reperfusion (IR) in this animal model. SG formation is triggered by both eukaryotic translation initiation factor (eIF) 2α phosphorylation and eIF4F complex dysfunction. We analyzed SGs by immunofluorescence colocalization of granule-associated protein T-cell internal antigen-1 with eIF3b, eIF4E, and ribosomal protein S6 and studied eIF2 and eIF4F complex. The results showed that IR stress induced SG formation in the CA1 region after 3-day reperfusion, consistent with TI and DND in CA1. SGs were formed independently of eIF2α phosphorylation, and their appearance was correlated with a decrease in the levels of eIF4F compounds, the cap-binding protein eIF4E, and eIF4B, suggesting that remodeling of the eIF4F complex was required for SG formation. Finally, pharmacological protection of CA1 ischemic neurons with cycloheximide decreased the formation of SGs and restored eIF4E and eIF4B levels in CA1. These findings link changes in eIF4B and eIF4E to SG induction in regions vulnerable to death after IR.

Keywords: brain; cell death; eukaryotic initiation factor 4B (eIF4B); eukaryotic translation initiation factor 4E (eIF4E); hippocampus; ischemia; stress granule; translation initiation; translation regulation.


Figures

FIGURE 1.
FIGURE 1.
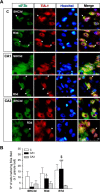
Identification of SGs by colocalization analysis of eIF3b and TIA-1 in the cerebral cortex and hippocampal CA1 and CA3 regions. A, brain sections of the cerebral cortex (C) or hippocampal CA1 or CA3 regions from control (SHC3d), R3d, and R7d animals were used for eIF3b and TIA-1 colocalization by confocal fluorescence microscopy for identification and quantification of the cells harboring SGs. eIF3b was labeled with Alexa Fluor 488 secondary antibody (in green), and TIA-1 was labeled with rhodamine Red-X secondary antibody (in red). Green and red channels were merged, and eIF3b/TIA-1 colocalization showed punctate aggregates in yellow as SGs (arrows). The nuclei stained with Hoechst are blue. This figure shows representative results from three to four different animals. The scale bar is in μm. B, the bar diagram represents the quantification of the number of cells harboring SGs per field (eIF3b/TIA-1 colocalization in ≥1 granule/cell). Bars represent the mean ± S.D. of three to four independent animals analyzed. Error bars represent S.D. ***, p < 0.001 and *, p < 0.05, CA1 R7d and R3d compared with CA1 SHC3d; $, p < 0.05, CA1 R7d compared with CA1 R3d.
FIGURE 2.
FIGURE 2.
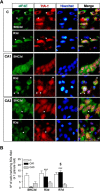
Identification of SGs by colocalization analysis of eIF4E and TIA-1 in the cerebral cortex and hippocampal CA1 and CA3 regions. A, brain sections as in Fig. 1 were used for eIF4E and TIA-1 colocalization by confocal fluorescence microscopy for identification and quantification of cells harboring SGs. eIF4E was labeled with FITC secondary antibody (in green), and TIA-1 was labeled (in red) as in Fig. 1. eIF4E/TIA-1 colocalization showed punctate aggregates in yellow as SGs (arrows). The nuclei stained with Hoechst are blue. This figure shows representative results from three to four different animals. The scale bar is in μm. B, the bar diagram represents the quantification of the number of cells harboring SGs per field (eIF4E/TIA-1 colocalization in ≥1 granule/cell). Bars represent the mean ± S.D. of three to four independent animals analyzed. Error bars represent S.D. ***, p < 0.001, CA1 R7d and R3d compared with CA1 SHC3d; $, p < 0.05, CA1 R7d compared with CA1 R3d. C, cerebral cortex.
FIGURE 3.
FIGURE 3.
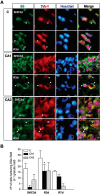
Identification of SGs by colocalization analysis of S6 and TIA-1 in the cerebral cortex and hippocampal CA1 and CA3 regions. A, brain sections as in Fig. 1 were used for S6 and TIA-1 colocalization by confocal fluorescence microscopy for identification and quantification of cells harboring SGs. S6 was visualized using FITC secondary antibody (in green), and TIA-1 was labeled (in red) as in Fig. 1. S6/TIA-1 colocalization showed punctate aggregates in yellow as SGs (arrows), and the nuclei stained with Hoechst are blue. Figures show representative results from three to nine different animals. The scale bar is in μm. B, the bar diagram represents the quantification of the number of cells harboring SGs per field (S6/TIA-1 colocalization in ≥1 granule/cell). Bars represent the mean ± S.D. of three to nine independent animals analyzed. Error bars represent S.D. *, p < 0.05 compared with SHC3d. C, cerebral cortex.
FIGURE 4.
FIGURE 4.
Polysome dissociation upon reperfusion in the hippocampal CA1 region. Polysome profiles were obtained from samples of the hippocampal CA1 region from control (SHC3d) and R3d animals. The values are the ratio of polysome (P)/80S monosome species. Figures show representative results from three independent experiments. **, p < 0.01, CA1 R3d compared with CA1 SHC3d by t test. Abs, absorbance.
FIGURE 5.
FIGURE 5.
SG induction in the CA1 region preceded neuronal death. A, brain sections of the hippocampal CA1 region from control (SHC3d), R1d, R2d, R2.5, R3d, and R7d animals were used for eIF4E (in green) and TIA-1 (in red) colocalization by confocal fluorescence microscopy for identification and quantification of the cells harboring SGs as in Fig. 2. eIF4E/TIA-1 colocalization showed punctate aggregates in yellow as SGs (arrows). Adjacent brain sections were used for apoptosis detection by TUNEL assay (in green). Cell nuclei were stained with Hoechst 33342 dye (insets, in blue). The pictures show representative results from four different animals (SHC3d and R7d not shown). The scale bar is in μm. B, brain sections of CA1 R3d as in A were co-labeled for eIF4E with Cy5 secondary antibody (in green), TIA-1 with rhodamine Red-X secondary antibody (in red), and TUNEL assay (in light blue). No co-labeling between SGs (in yellow; arrows) and TUNEL was detected. C and D, quantification of cells harboring SGs (black line) or TUNEL-positive apoptotic cell nuclei (blue line) in CA1 is represented in number of cells per field (C) or expressed as a percentage of the total cell number (D). In C (triangles), data were aggregated to each time interval. Data are indicated as mean ± S.D. of four independent animals analyzed per group. Error bars represent S.D. **, p < 0.01 and ***, p < 0.001, R2d, R2.5d, R3d, or R7d compared with the control or R1d. The inset graphs show the linear regression after logarithmic transformation.
FIGURE 6.
FIGURE 6.
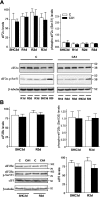
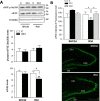
Levels of eIF2α, eIF2α phosphorylation, eIF2Bϵ, eIF2Bϵ phosphorylation, and eIF5 after IR. A, samples of the cerebral cortex (C) or hippocampal CA1 region from control (SHC3d), R30, R1d, R2d, and R3d animals were subjected to SDS-PAGE and Western blotting. The bottom panels show a representative Western blot developed for anti-eIF2α and anti-phospho-eIF2α Ser51 (eIF4E p-Ser51) antibodies. B, SHC3d and R3d samples of cerebral cortex or CA1 were subjected to SDS-PAGE and Western blotting using anti-eIF2Bϵ, anti-phospho-eIF2Bϵ Ser535 (eIF2Bϵ p-Ser535), and anti-eIF5 antibodies. In A and B, bar graphs show the data of the quantification of translational factor levels; phospho forms are quantified with respect to total levels of the protein (ratios). Data are from three to seven different animals run in duplicate; error bars indicate S.D. Comparisons were not significant (p > 0.05). The numbers to the right of the Western blots indicate the apparent molecular mass in kDa from protein markers.
FIGURE 7.
FIGURE 7.
Levels of eIF4G, eIF4A, and eIF4B after IR. A, samples of the cerebral cortex (C) or hippocampal CA1 region from control (SHC3d) and R3d animals were subjected to SDS-PAGE and Western blotting with anti-eIF4G and anti-eIF4A antibodies and anti-eIF4B antibody 3592. Figures show representative results. Bar graphs show the quantification of translational factor levels from four to seven different animals run in duplicate. Error bars indicate S.D. *, p < 0.05, CA1 R3d compared with CA1 SHC3d. The numbers to the right of the Western blots indicate the apparent molecular mass in kDa from protein markers. B, brain sections of the cerebral cortex (C) or hippocampal CA1 or CA3 regions from SHC3d and R3d were used for identification and quantification of eIF4B in cells. eIF4B was detected with anti-eIF4B antibody D-4 and labeled with FITC secondary antibody. Squares show representative results of eIF4B-labeled cells in cerebral cortex, CA1, or CA3. The bar graph shows the quantification of the intensity of fluorescence per cell of eIF4B labeled in brain sections. Bars represent the mean ± S.D. of four independent animals analyzed. Error bars represent S.D. *, p < 0.05, CA1 R3d compared with CA1 SHC3d; $, p < 0.05, cerebral cortex or CA3 R3d compared with CA1 R3d. The scale bar is in μm. Lower magnification images (landscape images) show the decrease of eIF4B label in CA1 R3d compared with SHC3d or CA3 R3d. GD, gyrus dentatus.
FIGURE 8.
FIGURE 8.
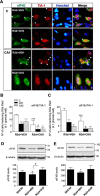
Levels of eIF4E and eIF4E phosphorylation at Ser209 site after IR. A, samples as described in Fig. 7 were subjected to SDS-PAGE and Western blotting with anti-eIF4E and anti-phospho-eIF4E Ser209 (eIF4E p-Ser209) antibodies. Figures show representative results. Bar graphs show the quantification of eIF4E levels from six to eight different animals run in duplicate. Error bars indicate S.D. **, p < 0.01, CA1 R3d compared with CA1 SHC3d; $, p < 0.05, C R3d compared with CA1 R3d. The numbers to the right of the Western blots indicate the apparent molecular mass in kDa from protein markers. B, the bar graph shows the quantification of the intensity of fluorescence per cell of eIF4E labeled in Fig. 2 (eIF4E images). Error bars indicate S.D. **, p < 0.01, CA1 R3d compared with CA1 SHC3d; $, p < 0.05, cerebral cortex or CA3 R3d compared with CA1 R3d. The scale bar is in μm. Lower magnified images show the decreasing of eIF4E label in CA1 R3d compared with SHC3d or CA3 R3d. C, cerebral cortex; GD, gyrus dentatus.
FIGURE 9.
FIGURE 9.
CHX treatment inhibits SG formation in the CA1 region after IR. A, brain sections of the cerebral cortex (C) or hippocampal CA1 region or CA3 region (images not shown) from untreated (vehicle (VEH)) or treated (1 mg/kg CHX in vehicle) R3d animals (R3d+VEH and R3d+CHX, respectively) were used for eIF4E and TIA-1 colocalization by confocal fluorescence microscopy for identification and quantification of the cells harboring SGs as described in Fig. 2. Figures show representative results from three to four different animals. Scale bar, 50 μm. B, the bar diagram represents quantification of cells harboring SGs per field (eIF4E/TIA-1 colocalization in ≥1 granule/cell). C, the bar diagram represents quantification of the number of cells harboring SGs using eIF3b/TIA-1 colocalization as in Fig. 1. In B and C, bars represent the mean ± S.D. of three to four independent animals analyzed. Error bars represent S.D. ***, p < 0.001 and *, p < 0.05, R3d+CHX compared with R3d+VEH. D and E, CA1 samples from control (SHC3d), untreated (R3d+VEH), and treated (R3d+CHX) animals as in A were subjected to Western blotting with anti-eIF4E (D) or anti-eIF4B (E) antibodies. Figures show representative results. Bar graphs show quantification of eIF4E or eIF4B levels from three to eight different animals run in duplicate. Error bars indicate S.D. *, p < 0.05, CA1 R3d+VEH compared with CA1 SHC3d; $, p < 0.05, CA1 R3d+CHX compared with CA1 R3d+VEH. The numbers to the right of the Western blots indicate the apparent molecular mass in kDa from protein markers.
FIGURE 10.
FIGURE 10.
CHX prevents the IR-induced decrease of eIF4E and eIF4B in the CA1 region. A, the bar graph shows the quantification of the intensity of fluorescence per cell of eIF4E labeled in Fig. 9A (eIF4E images). Lower magnification images show the increase of eIF4E label in CA1 R3d+CHX compared with R3d+VEH. B, brain sections of cerebral cortex (C), CA1, or CA3 from R3d+VEH and R3d+CHX as in Fig. 9A were used for identification and quantification of eIF4B in cells. eIF4B was labeled with FITC secondary antibody. Squares show representative results of eIF4B-labeled cells in cerebral cortex, CA1, or CA3. The bar graph shows the quantification of the intensity of fluorescence per cell of eIF4B labeled in brain sections. Lower magnification images (landscape images) show the increase of eIF4B label in CA1 R3d+CHX compared with R3d+VEH. In A and B, bars represent the mean ± S.D. of three to four different animals analyzed; data of eIF4E and eIF4B SHC3d controls were from Figs. 8B and 7B, respectively. Comparisons were performed for each region. Error bars represent S.D. **, p < 0.01, CA1 R3d+VEH compared with SHC3d or R3d+CHX. The scale bars are in μm. GD, gyrus dentatus.

Similar articles

Cited by

References

    1. Anderson P., and Kedersha N. (2002) Stressful initiations. J. Cell Sci. 115, 3227–3234 - PubMed
    1. Anderson P., and Kedersha N. (2006) RNA granules. J. Cell Biol. 172, 803–808 - PMC - PubMed
    1. Mazroui R., Di Marco S., Kaufman R. J., and Gallouzi I.-E. (2007) Inhibition of the ubiquitin-proteasome system induces stress granule formation. Mol. Biol. Cell 18, 2603–2618 - PMC - PubMed
    1. Gonzalez C. I., Wilusz C. J., and Wilusz J. (2007) The interface between mRNA turnover and translational control, in Translational Control in Biology and Medicine (Mathews M. B., Sonenberg N., and Hershey J. W. B., eds) pp. 719–745, Cold Spring Harbor Laboratory Press, Cold Spring Harbor, NY
    1. Kedersha N., and Anderson P. (2007) Mammalian stress granules and processing bodies. Methods Enzymol. 431, 61–81 - PubMed

Publication types

Substances

LinkOut - more resources