. 2016 Dec 23;291(52):26762-26772.
doi: 10.1074/jbc.M116.759175. Epub 2016 Nov 11.

WZB117 (2-Fluoro-6-(m-hydroxybenzoyloxy) Phenyl m-Hydroxybenzoate) Inhibits GLUT1-mediated Sugar Transport by Binding Reversibly at the Exofacial Sugar Binding Site

Affiliations

WZB117 (2-Fluoro-6-(m-hydroxybenzoyloxy) Phenyl m-Hydroxybenzoate) Inhibits GLUT1-mediated Sugar Transport by Binding Reversibly at the Exofacial Sugar Binding Site

Ogooluwa A Ojelabi et al. J Biol Chem. .

Abstract

WZB117 (2-fluoro-6-(m-hydroxybenzoyloxy) phenyl m-hydroxybenzoate) inhibits passive sugar transport in human erythrocytes and cancer cell lines and, by limiting glycolysis, inhibits tumor growth in mice. This study explores how WZB117 inhibits the erythrocyte sugar transporter glucose transport protein 1 (GLUT1) and examines the transporter isoform specificity of inhibition. WZB117 reversibly and competitively inhibits erythrocyte 3-O-methylglucose (3MG) uptake with Ki(app) = 6 μm but is a noncompetitive inhibitor of sugar exit. Cytochalasin B (CB) is a reversible, noncompetitive inhibitor of 3MG uptake with Ki(app) = 0.3 μm but is a competitive inhibitor of sugar exit indicating that WZB117 and CB bind at exofacial and endofacial sugar binding sites, respectively. WZB117 inhibition of GLUTs expressed in HEK293 cells follows the order of potency: insulin-regulated GLUT4 ≫ GLUT1 ≈ neuronal GLUT3. This may explain WZB117-induced murine lipodystrophy. Molecular docking suggests the following. 1) The WZB117 binding envelopes of exofacial GLUT1 and GLUT4 conformers differ significantly. 2) GLUT1 and GLUT4 exofacial conformers present multiple, adjacent glucose binding sites that overlap with WZB117 binding envelopes. 3) The GLUT1 exofacial conformer lacks a CB binding site. 4) The inward GLUT1 conformer presents overlapping endofacial WZB117, d-glucose, and CB binding envelopes. Interrogating the GLUT1 mechanism using WZB117 reveals that subsaturating WZB117 and CB stimulate erythrocyte 3MG uptake. Extracellular WZB117 does not affect CB binding to GLUT1, but intracellular WZB117 inhibits CB binding. These findings are incompatible with the alternating conformer carrier for glucose transport but are consistent with either a multisubunit, allosteric transporter, or a transporter in which each subunit presents multiple, interacting ligand binding sites.

Keywords: competitive inhibition; facilitated diffusion; glucose transport; ligand binding; ligand-binding protein; membrane transport; membrane transport protein; molecular docking; protein structure.


Figures

FIGURE 1.
FIGURE 1.
Sensitivity of zero-trans 3MG (0.1 mm) uptake by erythrocytes to inhibition by WZB117. Ordinate: 3MG uptake in mmol/liter of cell water/min. Abscissa: WZB117 in μm. Each data point represents the mean ± S.E. of at least three separate measurements made in duplicate. The curves drawn through the points were computed by nonlinear regression assuming uptake is inhibited completely by inhibitor in a dose-dependent manner (see Equation 1). The results are: Ki(app) = 6.2 ± 1.6 μm, R2 = 0.946, standard error of regression = 0.0021 mmol/liter of cell water/min.
FIGURE 2.
FIGURE 2.
Reversibility of transport inhibition by WZB117 and by CB. Ordinate: 3MG uptake in mmol/liter of cell water/min. Abscissa: experimental treatment. Control cells saw no inhibitor during sugar uptake; WZB117 and CB cells were exposed to inhibitor (3 μm WZB117 and 0.5 μm CB respectively) for 15 min on ice before measurement of 3MG uptake in the presence of inhibitor. WZB117 -washout and CB-washout cells were exposed to inhibitor (3 μm WZB117 and 0.5 μm CB, respectively) for 15 min on ice followed by inhibitor removal and exposure to inhibitor-free medium for 15 min on ice and finally measurement of 3MG uptake in the absence of inhibitor. Each symbol (●) represents the mean of duplicate measurements. The horizontal line and error bars represent the mean ± S.E. of each condition. Unpaired t test analysis indicates: +, transport under all treatments is significantly lower (p < 0.005) than in control cells; ++, transport after washout treatment is significantly greater (p < 0.005) than in the corresponding non-washout treatment.
FIGURE 3.
FIGURE 3.
Effects of WZB117 and CB on Michaelis-Menten kinetics of zero-trans 3MG uptake (A), zero-trans 3MG exit (B and C), and equilibrium exchange 3MG uptake (D). Results are shown for control cells (○), WZB117-treated cells (●), and for CB-treated cells (▵). Each data point is the mean ± S.E. of three duplicate measurements. A, ordinate: 3MG uptake in mmol/liter of cell water/min. Abscissa: [3MG]o in mm. Curves drawn through the points were computed by nonlinear regression assuming Michaelis-Menten uptake kinetics (Equation 2) and have the following results: control cells (○),Vmax = 0.59 ± 0.03 mmol/liter of cell water/min, Km(app) = 1.05 ± 0.16 mm, R2 = 0.992, standard error of regression = 0.018 mmol/liter of cell water/min; WZB117 treatment (●): Vmax = 0.68 ± 0.04 mmol/liter of cell water/min, Km(app) = 2.77 ± 0.35 mm, R2 = 0.997, standard error of regression = 0.018 mmol/liter of cell water/min; CB treatment (▵): Vmax = 0.29 ± 0.05 mmol/liter of cell water/min, Km(app) = 1.67 ± 0.63 mm, R2 = 0.966, standard error of regression = 0.010 mmol/liter of cell water/min. B and C, ordinates: [3MG]i in mmol/liter of cell water. Abscissa: time In minutes. Curves drawn through the points were computed by nonlinear regression and numerical integration assuming Michaelis-Menten exit kinetics and have the following results: Control cells (○): Vmax = 2 mmol/liter of cell water/min, Km(app) = 15 mm; WZB117 treatment (●): Vmax = 0.8 mmol/liter of cell water/min, Km(app) = 15 mm; CB treatment (▵): Vmax = 2 mmol/liter of cell water/min, Km(app) = 47 mm. D, Hanes-Woolf plot of equilibrium exchange transport. Ordinate: [3MG]/rate of equilibrium exchange 3MG uptake in minutes. Abscissa: intracellular and extracellular [3MG] in mm. Lines drawn through the points were computed by nonlinear regression assuming that each line is described by Equation 3. The results are: control cells (○): Vmax = 13.39 ± 0.79 mmol/liter of cell water/min, Km(app) = 40.25 ± 3.57 mm, R2 = 0.990, standard error of regression = 0.17 min; WZB117 treatment (●): Vmax = 13.36 ± 2.02 mmol/liter of cell water/min, Km(app) = 82.25 ± 15.30 mm, R2 = 0.936, standard error of regression = 0.43 min; CB treatment (▵): Vmax = 8.87 ± 0.33 mmol/liter of cell water/min, Km(app) = 49.85 ± 2.55 mm, R2 = 0.996, standard error of regression = 0.16 min.
FIGURE 4.
FIGURE 4.
CB and WZB117 stimulate 3MG uptake at subsaturating inhibitor concentrations. Ordinate: relative 3MG uptake. Abscissa: Inhibitor concentration in μm. Results are shown for WZB117-treated cells (●), for CB-treated cells (▵), and for cells exposed to CB plus 5 μm WZB117 (▴). Each data point is the mean ± S.E. of three or more duplicate measurements. The curves drawn through the points were computed by nonlinear regression according to Equation 4 or Equation 1 and have the following constants: WZB117-treated cells (●) Δ1 = 0.152 ± 0.056, K1 = 0.0014 ± 0.0013 μm, K2 = 11.0 ± 2.4 μm, R2 = 0.952, standard error of regression = 0.09; CB-treated cells (▵) Δ1 = 0.653 ± 0.115, K1 = 0.012 ± 0.011 μm, K2 = 0.29 ± 0.10 μm, R2 = 0.974, standard error of regression = 0.09; cells exposed to CB plus 5 μm WZB117 (▴) vo = 0.69 ± 0.02, K1 = 0.46 ± 0.07, R2 = 0.986, standard error of regression = 0.02. The arrows represent IC50 for CB inhibition of transport in the absence (solid lines) or presence (dashed lines) of 5 μm WZB117 respectively. Differences between transport in the absence and presence of each concentration of inhibitor were analyzed by ordinary one-way ANOVA using Dunnett's multiple comparisons test with a single pooled variance and a family-wise significance and confidence level of 0.01. CB (10 and 50 nm) and WZB117 (100 nm) significantly increased 3MG uptake. Transport inhibition is significant at WZB117 >5 μm and at CB >250 nm.
FIGURE 5.
FIGURE 5.
WZB117 is without effect on [3H]CB binding to human RBCs (●) but serves as a low affinity inhibitor of CB binding to red cell membranes depleted of peripheral membrane proteins (○). The lines drawn through the points were computed by linear regression. Ki(app) for inhibition of CB binding is computed as the -x-intercept. The results are: RBCs (●) Ki(app) = 373 ± 310 μm, R2 = 0.238, p value testing the null hypothesis that the overall slope is zero = 0.2765; membranes (○) Ki(app) = 150.4 ± 24.4 μm; R2 = 0.943, p value testing the null hypothesis that the overall slope is zero = 0.0058.
FIGURE 6.
FIGURE 6.
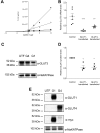
WZB117 inhibition of sugar transport is GLUT isoform-specific. A, Dixon plot of transport inhibition by WZB117 in untransfected HEK293 cells (○) and in cells transfected with and expressing hGLUT1 (●), hGLUT3 (▵), or hGLUT4 (▴). Ordinate: 1/2DG uptake in min·μg protein/mol. Abscissa: WZB117 in μm. Lines drawn through the points were computed by linear regression and Ki(app) for WZB117 inhibition of transport computed as -x- intercept. The results are: untransfected cells (○), Ki(app) = 2.45 ± 0.66 μm, R2 = 0.975, standard error of regression = 3.66 × 10¹⁰ min·μg protein/mol; hGLUT1-transfected cells (●), Ki(app) = 5.71 ± 0.95 μm, R2 = 0.974, standard error of regression = 7.59 × 10⁹ min·μg protein/mol; hGLUT3-transfected cells (▵), Ki(app) = 13.32 ± 5.12 μm, R2 = 0.862, standard error of regression = 8.82 × 10⁹ min·μg protein/mol; hGLUT4-transfected cells (▴), Ki(app) = 0.23 ± 0.47 μm, R2 = 0.977, standard error of regression = 1.09 × 10¹¹ min·μg protein/mol. B, effect of heterologous GLUT1 or GLUT4 expression on parental GLUT3 mRNA levels as detected by qPCR. For each condition the symbols (●) show the results of six separate measurements, and the horizontal lines plus error bars show their mean ± S.E. The conditions are untransfected (Control), GLUT1-transfected, and GLUT4-transfected cells. Results are normalized to one of the six GLUT3 message levels measured in untransfected cells. Ordinary one-way ANOVA shows that GLUT3 mRNA expression is significantly reduced in GLUT1-transfected and GLUT4-transfected cells relative to control cells (+++, p = 0.0001; ++, p = 0.0025). C, effect of heterologous GLUT1 or GLUT4 expression on parental GLUT3 expression. Results are shown for untransfected (UTF), GLUT1-transfected (G1), and GLUT4-transfected (G4) cells. Total GLUT3 and NaKATPase expression were assayed by obtaining whole cell lysates followed by SDS-PAGE of protein load-normalized samples and immunoblotting using protein-directed antibodies. Molecular mass markers are shown. D, quantitation of the effect of heterologous GLUT1 or GLUT4 expression on parental GLUT3 protein levels. Results (normalized to parental GLUT3 levels in untransfected cells as in Fig. 6 C) are shown for untransfected (Control), GLUT1-transfected (G1) and GLUT4-transfected (G3) cells. For each condition the symbols (●) show the results of four separate measurements, and the horizontal lines plus error bars show their mean ± S.E. Ordinary one-way ANOVA (+) shows that GLUT3 expression is significantly reduced in G1 and G4 cells relative to control cells (p = 0.0014). E, heterologous expression of GLUT1 and GLUT4 in HEK293 cells. Results are shown for untransfected (UTF), GLUT1-transfected (G1), and GLUT4-transfected (G4) cells. The GLUT1, GLUT4, and NaKATPase contents of protein load-normalized, whole cell lysates were assayed by immunoblot analysis using transporter specific (peptide-directed) antibodies (α-GLUT1, α-GLUT4, or α-NaKATPase IgGs) or with GLUT1 and GLUT4 by using α-myc IgGs. Molecular mass markers are shown. Heterologous expression of GLUT1 increased HEK293 cell GLUT1 expression over untransfected cells by 47.5- and 30.8-fold using-fold α-GLUT1 and α-myc IgGs, respectively. Heterologous expression of GLUT4 increased HEK293 cell GLUT4 expression over untransfected cells by 58.7- and 3.6-fold using α-GLUT4 and α-myc IgGs, respectively.
FIGURE 7.
FIGURE 7.
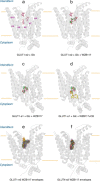
Molecular docking studies of ligand binding to hm-GLUT1 and hm-GLUT4. a, hm-GLUT1-e2 complexed with peripheral, intermediate, and core β-d-glucose molecules (red). GLUT1 is shown in transparent, schematic representation normal to the bilayer plane (horizontal yellow lines), membrane spanning α-helices (H1, H5, H6, H8, H9, and H10) are indicated, and locations of the interstitium and cytoplasm are highlighted. b, hm-GLUT1-e2 complexed with β-d-glucose molecules (red) and WZB117 (green). c, human GLUT1-e1 conformation complexed with intermediate and core β-d-glucose molecules (red) and WZB117 (green). d, human GLUT1-e1 conformation complexed with β-d-glucose molecules (red), WZB117 (green), and CB (yellow). e, hm-GLUT1-e2 conformation complexed with WZB117. The majority of computed binding sites (28 of 30) overlap with intermediate and core Glc binding sites. f, hm-GLUT4 e2 conformation complexed with WZB117. 30 potential binding sites are indicated; all overlap with peripheral and core Glc binding sites.
FIGURE 8.
FIGURE 8.
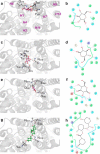
β-d-Glucose (a–f) and WZB117 (g and h) binding to hm-GLUT1-e2. The perspective is looking into the exofacial cavity of hm-GLUT1-e2 from the interstitium. The identities of several membrane spanning α helices (H1, H2, H4, H5, H7, H9, H11, and H12) are indicated in magenta in a. β-d-Glucose (in red) is shown docked to the peripheral (a and b), intermediate (c and d), and core (e and f) sites. Computed ΔG for ligand binding: peripheral, d-Glc binding site ΔG = −5.1 kcal/mol; intermediate d-Glc binding site ΔG = −5.1 kcal/mol; core binding site = −4.9 kcal/mol. WZB117 is shown in green (g), and its docking site overlaps with intermediate and core β-d-Glc binding sites. ΔG for WZB117 binding = −8.22 kcal/mol. Note that two additional configurations of WZB117-hm-GLUT1-e2 interactions were observed: one in which WZB117 interacts with and spans peripheral and core β-d-glucose binding sites (ΔG = −7.37 kcal/mol) and a second where WZB117interacts only with the peripheral and intermediate β-d-glucose binding sites (ΔG = −6.74 kcal/mol). Binding is shown as two representations: 1) three-dimensional in which GLUT1 is represented in transparent schematic format, Glc and WZB117 is in stick format, and H-bonds are represented as dashed lines (a, c, e, and g); 2) two-dimensional format in which Glc and WZB117 are shown as two-dimensional structures, coordinating GLUT1 residues are shown as circles, GLUT1 backbones are shown as ribbons, solvent-exposed regions of β-d-Glc and WZB117 are indicated by gray-shaded circles, and H-bonds and their directionality are represented as red arrows (b, d, f, and h).

Similar articles

Cited by

References

    1. Vander Heiden M. G., Cantley L. C., and Thompson C. B. (2009) Understanding the Warburg effect: the metabolic requirements of cell proliferation. Science 324, 1029–1033 - PMC - PubMed
    1. Palorini R., Cammarata F. P., Cammarata F., Balestrieri C., Monestiroli A., Vasso M., Gelfi C., Alberghina L., and Chiaradonna F. (2013) Glucose starvation induces cell death in K-ras-transformed cells by interfering with the hexosamine biosynthesis pathway and activating the unfolded protein response. Cell Death Dis. 4, e732. - PMC - PubMed
    1. Warburg O. (1956) On the origin of cancer cells. Science 123, 309–314 - PubMed
    1. De Giorgis V., and Veggiotti P. (2013) GLUT1 deficiency syndrome 2013: current state of the art. Seizure 22, 803–811 - PubMed
    1. Pelicano H., Martin D. S., Xu R. H., and Huang P. (2006) Glycolysis inhibition for anticancer treatment. Oncogene 25, 4633–4646 - PubMed

MeSH terms