. 2016 Nov 15;45(5):1024-1037.
doi: 10.1016/j.immuni.2016.10.017. Epub 2016 Nov 8.

Constitutive Glycolytic Metabolism Supports CD8+ T Cell Effector Memory Differentiation during Viral Infection

Affiliations

Constitutive Glycolytic Metabolism Supports CD8+ T Cell Effector Memory Differentiation during Viral Infection

Anthony T Phan et al. Immunity. .

Abstract

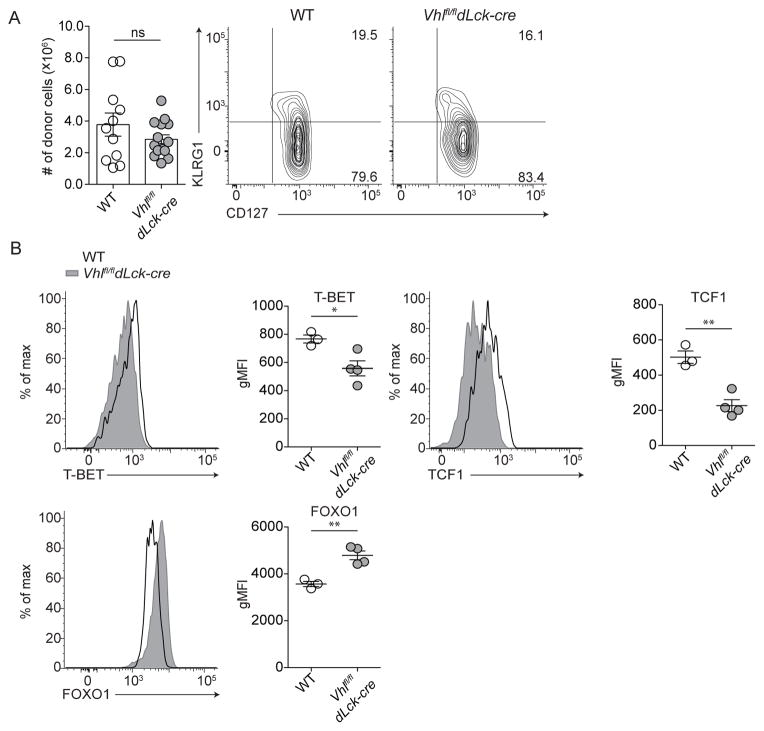
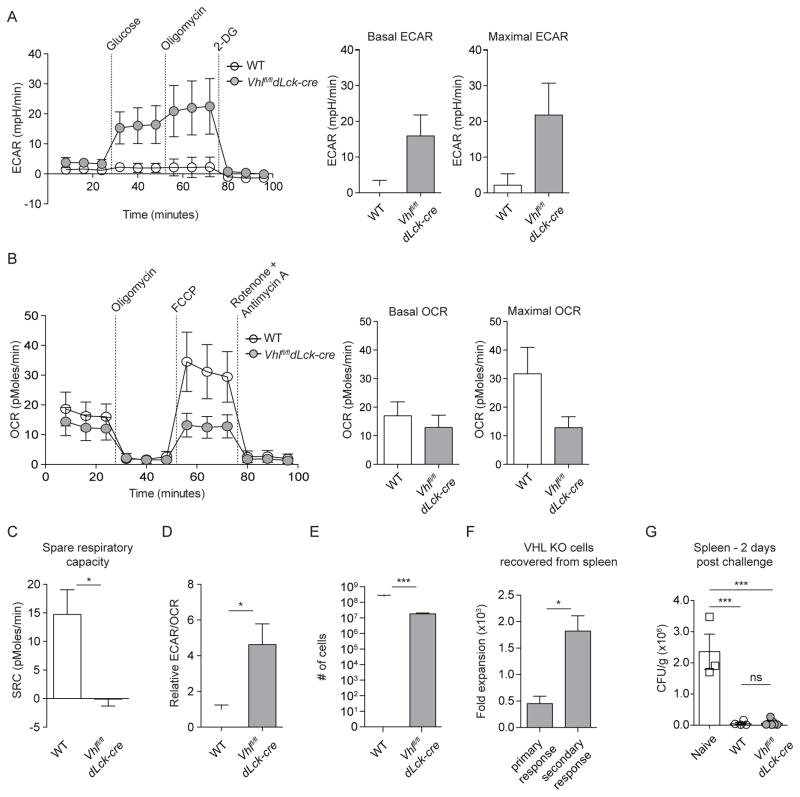
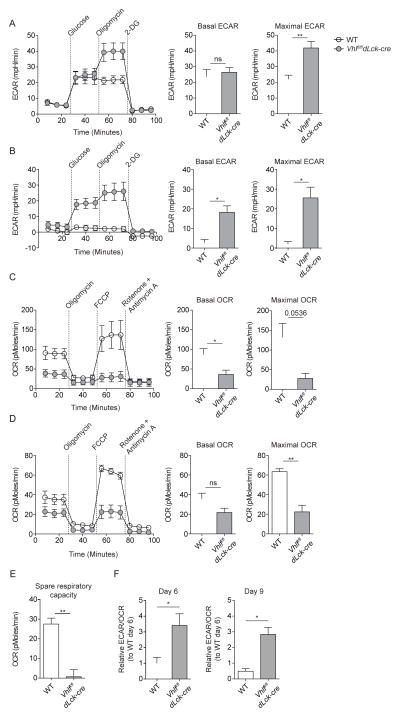
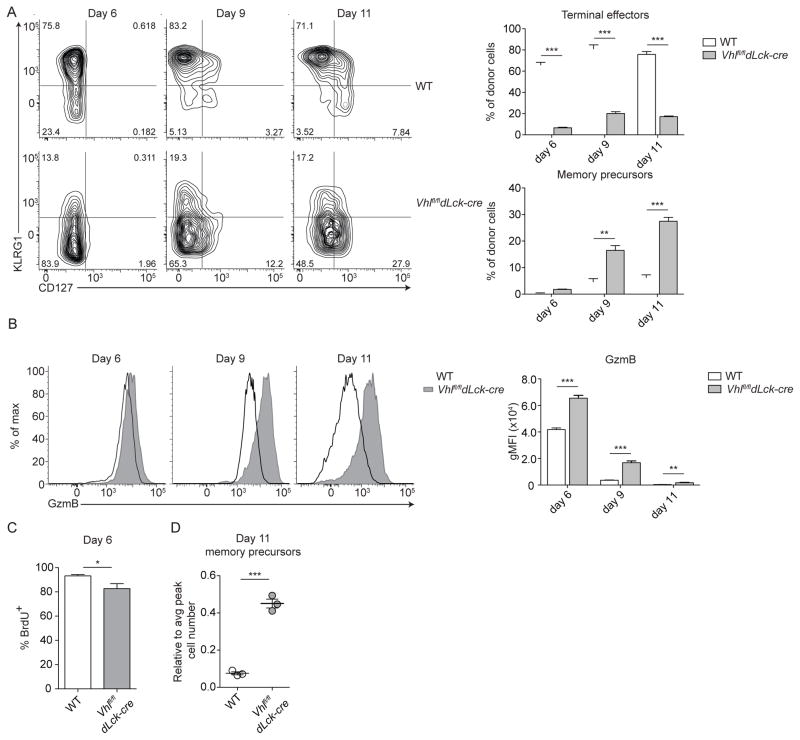
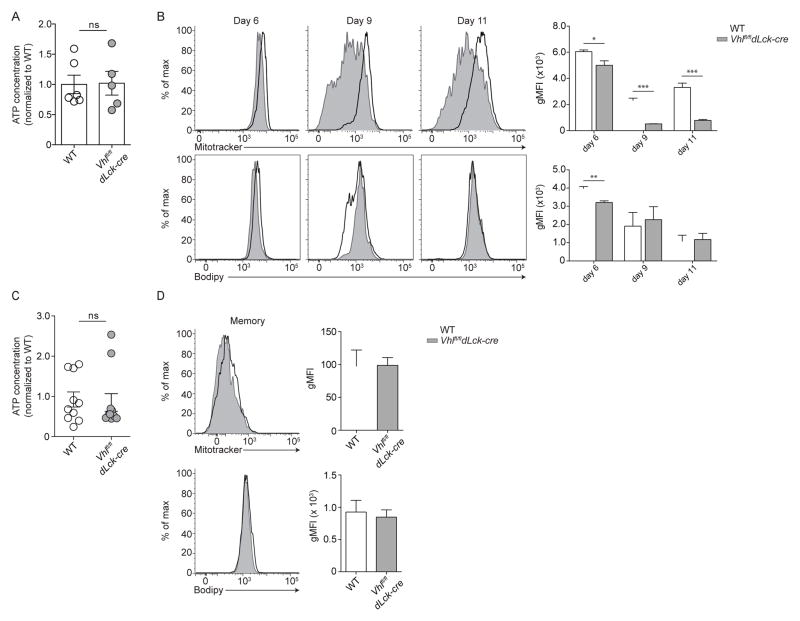
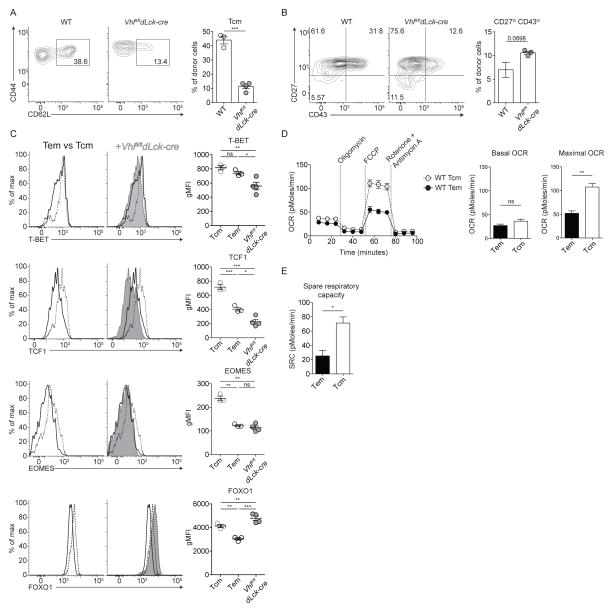
Extensive metabolic changes accompany T cell activation, including a switch to glycolytic energy production and increased biosynthesis. Recent studies suggest that subsequent return to reliance on oxidative phosphorylation and increasing spare respiratory capacity are essential for the differentiation of memory CD8+ T cells. In contrast, we found that constitutive glycolytic metabolism and suppression of oxidative phosphorylation in CD8+ T cells, achieved by conditional deletion of hypoxia-inducible factor regulator Vhl, accelerated CD8+ memory cell differentiation during viral infection. Despite sustained glycolysis, CD8+ memory cells emerged that upregulated key memory-associated cytokine receptors and transcription factors and showed a heightened response to secondary challenge. In addition, increased glycolysis not only permitted memory formation, but it also favored the formation of long-lived effector-memory CD8+ T cells. These data redefine the role of cellular metabolism in memory cell differentiation, showing that reliance on glycolytic metabolism does not hinder formation of a protective memory population.


Figures

Figure 1
Figure 1. VHL-deficient CD8+ T cells form long-lived memory CD8+ T cells
(A) Representative KLRG1 and CD127 surface phenotype of memory WT and Vhlfl/fldLck-cre cells (n = 3–5 per 5 independent experiments) and absolute numbers from spleen of host mice (cumulative from 4 independent experiments, n = 26). (B) Representative flow cytometric quantitation of transcription factors; total donor WT (open black histogram) or Vhlfl/fldLck-cre (filled grey histogram) cells from spleen. gMFI of total donor WT or Vhlfl/fldLck-cre memory CD8+ T cells (n = 3–5 per 5 independent experiments). (A) Numbers represent percentage of cells in respective gates. Data in (AB) show mean ± SEM with Student’s t test, ns p > 0.05, * p < 0.05, ** p < 0.01.
Figure 2
Figure 2. Memory Vhlfl/fldLck-cre CD8+ T cells rely on glycolytic metabolism and are functional secondary effectors
(AD) Experimental design as in Figure S1A, (n = 3–5), WT or Vhlfl/fldLck-cre donor cells were sorted from pooled spleens and lymph nodes and assayed directly ex vivo with the Seahorse Extracellular Flux XF-96 analyzer under basal conditions and following addition of indicated metabolic inhibitors. Data from 3 independent experiments with rate measurements normalized to 1.25x10⁵ cells/sample. (A) Extracellular Acidification Rate (ECAR) and (B) Oxygen Consumption Rate (OCR) of WT and Vhlfl/fldLck-cre cells at day >60 following acute viral infection measured over time after addition of metabolic inhibitors (left). Basal and maximal (A) ECAR or (B) OCR (right). (C) SRC of WT and Vhlfl/fldLck-cre cells calculated from (B). (D) Ratio of basal ECAR to basal OCR of WT and Vhlfl/fldLck-cre cells relative to ratio of WT cells from measurements in (B). Long-lived WT or Vhlfl/fldLck-cre donor cells were harvested from secondary lymphoid tissues, sort purified, and 1 x 10⁴ were retransferred into congenically distinct naive host mice followed by infection with LCMV Armstrong one day later. Representative absolute numbers (E) of donor WT or Vhlfl/fldLck-cre cells on day 5 of secondary challenge (n = 4–5 per 2 experiments) and comparative fold expansion (F) of Vhlfl/fldLck-cre effector cells following primary (day 6) versus secondary (day 5) LCMV Armstrong challenge from spleen. (G) Colony forming units (CFU) per gram of spleen 2 days following challenge with Lm-gp33 of naive B6 mice and mice with memory WT or Vhlfl/fldLck-cre cells. Data in (AG) show mean ± SEM: (AF) Student’s t test, ns p > 0.15, * p < 0.05, *** p < 0.001; (G) one-way ANOVA followed by Tukey’s Multiple Comparison Test, ns p > 0.05, *** p < 0.001. See also Figure S1.
Figure 3
Figure 3. Sustained HIF activity drives glycolysis and suppresses oxidative phosphorylation during the effector response
(AF) ECAR and OCR of KLRG1lo CD44hi WT and Vhlfl/fldLck-cre cells on (A,C) day 6 and (B,D) day 9 of infection (left). Summarized metabolic measures of basal and maximal ECAR or OCR of WT and Vhlfl/fldLck-cre cells (right). (E) Spare respiratory capacity (SRC) of WT and Vhlfl/fldLck-cre cells on day 9 of infection. (F) Ratio of basal ECAR to basal OCR of WT and Vhlfl/fldLck-cre cells at indicated day post infection relative to basal ECAR to basal OCR ratio of WT cells at 6 following infection. Data in (AF) are mean ± SEM with two-tailed Student’s t test. ns p > 0.05, * p < 0.05, ** p < 0.01. See also Figure S1.
Figure 4
Figure 4. Constitutive HIF activity enhances CD8+ memory cell formation
(A) Representative surface phenotype of donor WT (top) or Vhlfl/fldLck-cre (bottom) cells at indicated time points following acute viral infection from spleen (n = 3–5 per 3 independent experiments). Numbers represent percentage of cells in respective gates. Bar graphs summarize percentage of terminal effectors and memory precursors of indicated donor cells. (B) Representative intracellular staining of Granzyme B (GzmB) expression of donor WT (open black histogram) or Vhlfl/fldLck-cre (filled grey histogram) cells from spleen at indicated time points. Bar graph shows geometric mean fluorescence intensity (gMFI) of indicated donor populations (n = 3–5 per 3 independent experiments) (C) Percent of indicated donor cells incorporating BrdU on day 6 of LCMV infection. (D) Efficiency of memory cell generation: To normalize Vhlfl/fldLck-cre and WT responses to their absolute number of memory-precursor WT or Vhlfl/fldLck-cre cells on day 11 of infection were divided by their respective peak number of responding donor WT or Vhlfl/fldLck-cre cells from day 9 of infection. (C,D) Representative data, n = 3–4 from 2 independent experiments. Data in (AD) show mean ± SEM with Student’s t test, * p < 0.05, ** p < 0.01, *** p < 0.001. See also Figure S2 and S3.
Figure 5
Figure 5. Glycolytic metabolism does not impair ATP production and compensates for suppressed oxidative phosphorylation
(A,C) Cellular ATP extracted from WT and Vhlfl/fldLck-cre donor cells (per 104 cells) sorted from spleen and lymph nodes of individual host mice (A) post peak of CD8+ response and (C) >60 days following infection. Data are relative to average WT cell ATP levels. Cumulative data (n = 6 mice) from two independent experiments. (B,D) Representative flow cytometric analysis of total donor WT (open black histogram) or Vhlfl/fldLck-cre (filled grey histogram) cells for analysis of mitochondrial mass and free fatty acid levels at indicated time point following infection. Bar graphs show Mitotracker and Bodipy gMFI of indicated donor populations. (B, n = 3–4 mice per 2 independent experiments D, n = 3–5 mice per 3 independent experiments). Data in (A,C) show mean ± SEM with two-tailed Student’s t test, ns p > 0.5, * p < 0.05, ** p < 0.01, *** p <0.001.
Figure 6
Figure 6. Glycolytic metabolism correlates with differentiation of effector-memory CD8+ T cells
(A–B) Representative flow cytometric analysis of splenic WT or Vhlfl/fldLck-cre cells at memory time points (A) for effector memory and central memory CD8+ T cell subsets (n = 3–5 per 4 independent experiments) with summarized frequency of central memory cells. (B) CD27 and CD43 expression and summarized frequency of CD27loCD43lo memory cells (n = 3 per 2 independent experiments). (C) Representative expression of transcription factors and cytokine receptors of WT central memory (Tcm, dashed line) and effector memory cells (Tem, black line, left histograms) and with total Vhlfl/fldLck-cre memory cell (grey filled) expression overlaid for comparison (right histograms). Representative staining of n = 3–5 per 4 independent experiments. gMFI of transcription factor expression for WT Tcm and Tem compared to total Vhlfl/fldLck-cre memory cells. (D) OCR of WT Tcm (dotted line) and Tem (solid line) measured as in Figure 2 (left) with basal and maximal OCR (right) of 3 independent experiments. (E) SRC of WT Tcm and Tem from (D). Data show mean ± SEM: (AB, DE) Student’s t test, ns p > 0.05, *** p < 0.0005; (C) one-way ANOVA followed by Tukey’s Multiple Comparison Test, ns p > 0.05, * p < 0.05, ** p < 0.01, *** p < 0.001.

Comment in

Similar articles

Cited by

References

    1. Araki K, Turner AP, Shaffer VO, Gangappa S, Keller SA, Bachmann MF, Larsen CP, Ahmed R. mTOR regulates memory CD8 T-cell differentiation. Nature. 2009;460:108–112. - PMC - PubMed
    1. Blagih J, Coulombe F, Vincent Emma E, Dupuy F, Galicia-Vázquez G, Yurchenko E, Raissi Thomas C, van der Windt Gerritje JW, Viollet B, Pearce Erika L, et al. The Energy Sensor AMPK Regulates T Cell Metabolic Adaptation and Effector Responses In Vivo. Immunity. 2015;42:41–54. - PubMed
    1. Chang CH, Curtis Jonathan D, Maggi Leonard B, Faubert B, Villarino Alejandro V, O’Sullivan D, Huang Stanley C-C, van der Windt Gerritje JW, Blagih J, Qiu J, et al. Posttranscriptional Control of T Cell Effector Function by Aerobic Glycolysis. Cell. 2013;153:1239–1251. - PMC - PubMed
    1. Chang JT, Wherry EJ, Goldrath AW. Molecular regulation of effector and memory T cell differentiation. Nature Immunology. 2014;15:1104–1115. - PMC - PubMed
    1. Chaoul N, Fayolle C, Desrues B, Oberkampf M, Tang A, Ladant D, Leclerc C. Rapamycin Impairs Antitumor CD8+ T-cell Responses and Vaccine-Induced Tumor Eradication. Cancer Research. 2015;75:3279–3291. - PubMed

Publication types