

Controlled tip wear on high roughness surfaces yields gradual broadening and rounding of cantilever tips
- PMID: 27833143
- PMCID: PMC5105056
- DOI: 10.1038/srep36972
Controlled tip wear on high roughness surfaces yields gradual broadening and rounding of cantilever tips
Abstract
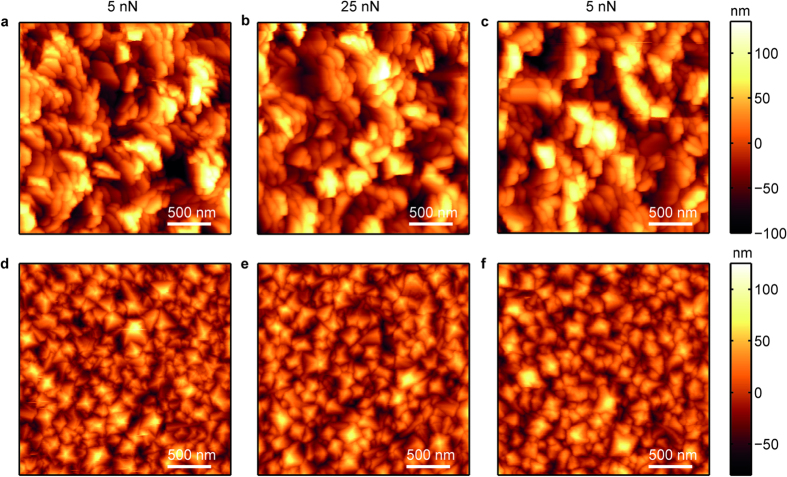
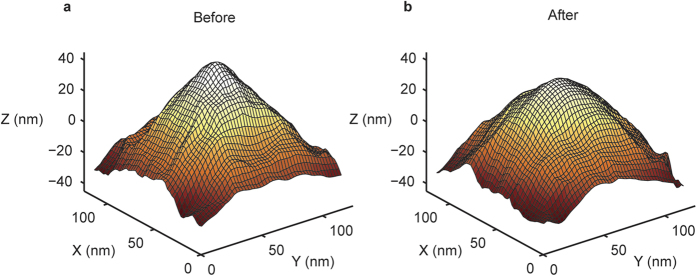
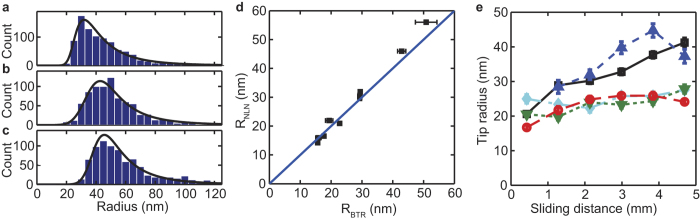
Tip size in atomic force microscopy (AFM) has a major impact on the resolution of images and on the results of nanoindentation experiments. Tip wear is therefore a key limitation in the application of AFM. Here we show, however, how wear can be turned into an advantage as it allows for directed tip shaping. We studied tip wear on high roughness polycrystalline titanium and diamond surfaces and show that tip wear on these surfaces leads to an increased tip size with a rounded shape of the apex. Next, we fitted single peaks from AFM images in order to track the changes in tip radius over time. This method is in excellent agreement with the conventional blind tip reconstruction method with the additional advantage that we could use it to demonstrate that the increase in tip size is gradual. Moreover, with our approach we can shape and control the tip size, while retaining identical chemical and cantilever properties. This significantly expands the reproducibility of AFM force spectroscopy data and is therefore expected to find a wide applicability.
Figures

Similar articles
-
Method for characterizing nanoscale wear of atomic force microscope tips.ACS Nano. 2010 Jul 27;4(7):3763-72. doi: 10.1021/nn100246g. ACS Nano. 2010. PMID: 20575565
-
Mechanics of interaction and atomic-scale wear of amplitude modulation atomic force microscopy probes.ACS Nano. 2013 Apr 23;7(4):3221-35. doi: 10.1021/nn305901n. Epub 2013 Mar 29. ACS Nano. 2013. PMID: 23506316
-
Practical method to limit tip-sample contact stress and prevent wear in amplitude modulation atomic force microscopy.ACS Nano. 2013 Nov 26;7(11):9836-50. doi: 10.1021/nn403435z. Epub 2013 Oct 23. ACS Nano. 2013. PMID: 24131354
-
Carbon nanotubes: a promising standard for quantitative evaluation of AFM tip apex geometry.Ultramicroscopy. 2007 Apr-May;107(4-5):293-8. doi: 10.1016/j.ultramic.2006.08.004. Epub 2006 Sep 7. Ultramicroscopy. 2007. PMID: 17011708
-
Ultrananocrystalline diamond tip integrated onto a heated atomic force microscope cantilever.Nanotechnology. 2012 Dec 14;23(49):495302. doi: 10.1088/0957-4484/23/49/495302. Epub 2012 Nov 13. Nanotechnology. 2012. PMID: 23149947
Cited by
-
Biophysical Approaches for Applying and Measuring Biological Forces.Adv Sci (Weinh). 2022 Feb;9(5):e2105254. doi: 10.1002/advs.202105254. Epub 2021 Dec 19. Adv Sci (Weinh). 2022. PMID: 34923777 Free PMC article. Review.
-
Competition between Bending and Internal Pressure Governs the Mechanics of Fluid Nanovesicles.ACS Nano. 2017 Mar 28;11(3):2628-2636. doi: 10.1021/acsnano.6b07302. Epub 2017 Mar 14. ACS Nano. 2017. PMID: 28273422 Free PMC article.
-
Mechanical Characterization of Liposomes and Extracellular Vesicles, a Protocol.Front Mol Biosci. 2020 Jul 21;7:139. doi: 10.3389/fmolb.2020.00139. eCollection 2020. Front Mol Biosci. 2020. PMID: 32850949 Free PMC article.
-
Atomic Force Microscopy Cantilever-Based Nanoindentation: Mechanical Property Measurements at the Nanoscale in Air and Fluid.J Vis Exp. 2022 Dec 2;(190):10.3791/64497. doi: 10.3791/64497. J Vis Exp. 2022. PMID: 36533832 Free PMC article.
-
Microparticle traction force microscopy reveals subcellular force exertion patterns in immune cell-target interactions.Nat Commun. 2020 Jan 7;11(1):20. doi: 10.1038/s41467-019-13804-z. Nat Commun. 2020. PMID: 31911639 Free PMC article.
References
-
- Müller D. J. & Dufrêne Y. F. Atomic force microscopy as a multifunctional molecular toolbox in nanobiotechnology. Nat. Nanotechnol. 3, 261–269 (2008). - PubMed
-
- Garcia R., Martinez R. V. & Martinez J. Nano-chemistry and scanning probe nanolithographies. Chem. Soc. Rev. 35, 29–38 (2006). - PubMed
-
- Xie X. N., Chung H. J., Sow C. H. & Wee A. T. S. Nanoscale materials patterning and engineering by atomic force microscopy nanolithography. Mater. Sci. Eng. R Reports 54, 1–48 (2006).
-
- Sneddon I. N. The relation between load and penetration in the axisymmetric boussinesq problem for a punch of arbitrary profile. Int. J. Eng. Sci. 3, 47–57 (1965).
-
- Cappella B. & Dietler G. Force-distance curves by atomic force microscopy. Surf. Sci. Rep. 34, 1–104 (1999).
Publication types
LinkOut - more resources
Full Text Sources
Other Literature Sources
Miscellaneous
