. 2016 Dec 15;129(24):4480-4495.
doi: 10.1242/jcs.188250. Epub 2016 Nov 9.

High resolution microscopy reveals the nuclear shape of budding yeast during cell cycle and in various biological states

Affiliations

High resolution microscopy reveals the nuclear shape of budding yeast during cell cycle and in various biological states

Renjie Wang et al. J Cell Sci. .

Abstract

How spatial organization of the genome depends on nuclear shape is unknown, mostly because accurate nuclear size and shape measurement is technically challenging. In large cell populations of the yeast Saccharomyces cerevisiae, we assessed the geometry (size and shape) of nuclei in three dimensions with a resolution of 30 nm. We improved an automated fluorescence localization method by implementing a post-acquisition correction of the spherical microscopic aberration along the z-axis, to detect the three dimensional (3D) positions of nuclear pore complexes (NPCs) in the nuclear envelope. Here, we used a method called NucQuant to accurately estimate the geometry of nuclei in 3D throughout the cell cycle. To increase the robustness of the statistics, we aggregated thousands of detected NPCs from a cell population in a single representation using the nucleolus or the spindle pole body (SPB) as references to align nuclei along the same axis. We could detect asymmetric changes of the nucleus associated with modification of nucleolar size. Stereotypical modification of the nucleus toward the nucleolus further confirmed the asymmetric properties of the nuclear envelope.

Keywords: Localization microscopy; Nuclear geometry; Nuclear pore complex; Super resolution microscopy.


Conflict of interest statement

The authors declare no competing or financial interests.

Figures
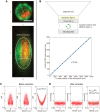
Fig. 1.
Fig. 1.
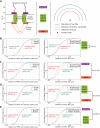
Detection and correction of the aberrations along the z axis. (A) Yeast nucleus in exponential phase with nuclear pores labeled in green and the nucleolus in red (maximum intensity projections of a 3D image stack in xy plane and xz plane). Yellow crosses show detected NPCs, green crosses show the nucleus center, blue crosses show nucleolus centroid. Green circles show the expected edge of the nucleus and white ellipse shows the detected edge. Strain yCNOD99-1a. Scale bar: 1 μm. (B) Immersion layer refractive index=1.51, cover slip 170 μm and refractive index=1.51, sample refractive index=1.38. Objective lens: NA=1.4×100, lambda=520 nm. Linear z-level shift of PSF mass center and the real z-axial position of the fluorophore. (C) The normalized distance distribution of the detected NPCs to the nuclear center along x-level, y-level and z-level before correction of the aberration along z axis. d, distance of NPCs to the nuclear center; R, radius of each nucleus. Strain yCNOD99-1a, a=0.26, b=0.0029, c=0.81. (D) The normalized distance distribution along x-level, y-level and z-level after correction of the aberration along z axis. dcorrect=corrected distances of NPCs to the nuclear center.
Fig. 2.
Fig. 2.
Resolution of NucQuant after correction of the aberration along the z axis. (A) Nuclear pore complex (NPC) architecture and nucleoporin localization in the NPC. (B–E) Cumulative frequency of distances to the nuclear center (left panels) and of distances to the fitted ellipsoid approximation of the nuclear envelope (right panels) using GFP or mRFP-tagged nucleoporins. (B) GFP–Nup49 and mRFP–Nup57, strain yRW3-1a. (C) GFP–Nup159 and mRFP–Nup2, strain yRW7-1a. (D) GFP–Nup49 and mRFP–Nup2, strain yRW4-1a. (E) GFP–Nup159 and mRFP–Nup57, strain yRW8-1a.
Fig. 3.
Fig. 3.
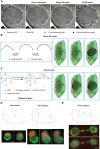
Extrapolation of nuclear envelope using detected NPCs. (A) 2D models building nuclear envelopes are represented onto electron microscopic micrographs of nuclear sections on which the positions of NPCs are visually detected (black arrows in the left panel). Strain BY4741. In the second image, the nuclear envelope is built by connecting adjacent NPCs. In the third image, the nuclear envelope is built by spline interpolation. In the right panel, the nuclear envelope is fitted by generating anchoring spots in nuclear envelope. Scale bars: 100 nm. (B,C) Based on the 3D confocal microscopic images, we could detect the NPC positions (blue spheres). Strain yCNOD99-1a. Using the spline-NE model (B), we refined the connection to get a smooth nuclear envelope. Red circles represent the spots that were used to refine the connection. 3D-NE model (C) generates additional anchoring spots (blue empty circle) to get an accurate extrapolation of the nuclear envelope. (D) The fitted nuclear envelope based on 3D-NE model for the nuclei characterized by one (left) or two (right) NPCs clusters. Upper graphs: x, y, z coordinates of detected NPCs; black cross, centroid of detected cluster(s); cluster 1 in red, cluster 2 in green. Strain yCNOD99-1a. (E) The fitted nuclear envelope based on 3D-NE model for the anaphase nuclei characterized using three NPCs clusters. Cluster 3 in blue. Strain yCNOD203-1a. Scale bars in D,E: 1 µm.
Fig. 4.
Fig. 4.
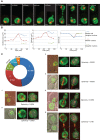
Living yeast nuclear geometry during the cell cycle. (A) Time course during a complete cell cycle of a single cell immobilized in a microfluidic device. NPCs in green and nucleolus in red (maximum intensity projections of a 3D image stack). Strain yCNOD99-1a. Note that a black rectangle of equivalent size was used as a background for cropped images. (B) The fitted nuclear envelope based on 3D-NE model for the nuclei in the different cell cycle phases. The surface of the nuclear envelope and the volume of nuclei allowed calculation of sphericity. (C) 3D-NE model fitting of different nuclear shapes (stages 1 to 6) throughout the cell cycle. The cell cycle is represented as a circle; the percentage of cells in each cell cycle phase from a large population was converted to duration (min). For each stage (panels 1 to 6), the DIC and the fluorescent (GFP–Nup49 and Bim1–tDimerRFP) pictures are displayed (stages 1 to 6). Strain yCNOD203-1a. The fitting using the 3D nuclear envelope model is also shown for each stage and was used to calculate sphericity. Scale bars: 1 µm.
Fig. 5.
Fig. 5.
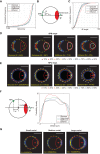
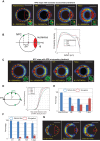
The nuclear geometry according to the carbon sources. (A) Cumulative distribution of sphericity of the interphase nuclei cultured in different carbon sources. Strain yCNOD99-1a. (B) Cylindrical coordinates system with an oriented axis in which the position of the SPB is described by its distance from the nuclear center (R) and the angle from the central axis (α). Nucleolus is displayed in red. Angle φ represent rotation around central axis. (C) Cumulative frequency of the angle α between SPB and the central axis. Strain yRW11-1a. (D) SPB probability density maps based on analysis of nuclei comparing glucose with different carbon sources containing media. In glucose: dashed yellow circle, nuclear envelope determined according to the 3D-NE method; red curve, median nucleolus; red dot, median nucleolar centroid. Compare nucleolar size in glucose (red) with nucleolar size in other carbons sources (white). N represents the number of nuclei used to generate the cumulative percentage maps. (E) NPCs probability density maps based on analysis of nuclei in exponential phase cells growing in different carbon sources. Strain yCNOD99-1a. Compare median nuclear size in glucose (white dashed circle) with other carbon sources (yellow dashed circles). N represents the number of cNPCs used to generate the cumulative percentage maps. (F) Plotted variation of NPC density along the central axis in response to different carbon sources. (G) Heterogeneity of NPC distribution in interphasic cells. Nuclei were sorted according to their size (1/3 small, 1/3 medium, 1/3 large nuclei. Strain yCNOD99-1a. Scale bars: 1 μm.
Fig. 6.
Fig. 6.
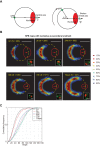
The reorganization of the nuclear central axis during quiescence. (A) The nuclear central axis (SPB–nuclear-center–nucleolar-centroid) is broken after the cells enter quiescence. Red ellipse, nucleolus; green circle, SPB; black cross, nucleus centroid; blue cross, nucleolus centroid; α, angle of SPB to the nuclear–nucleolar­centroid axis. (B) SPB probability density maps based on analysis of nuclei after indicated time of starvation (see Materials and Methods). Representative fluorescent pictures (GFP–Nup49, Spc42–GFP and mCherry–Nop1) are displayed. Scale bars: 1 μm. (C) Cumulative frequency of the angle α upon incubation in glucose-depleted medium (from 2 h to 7 days). Strain yRW11-1a.
Fig. 7.
Fig. 7.
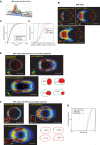
The nuclear envelope structure and NPC distribution during quiescence. (A) NPC probability density maps using the nucleolus as a secondary landmark upon time-progressive incubation in glucose-depleted medium. Representative fluorescent pictures (GFP–Nup49 and mCherry–Nop1) are displayed. Strain yCNOD99-1a. (B) Plotted variation of NPC density along the central axis during progressive starvation. (C) NPC probability density maps using SPB as a secondary landmark upon time­-progressive incubation in glucose-­depleted medium. Small red dot, SPB median position. Representative fluorescent pictures (GFP–Nup49 and SPC42–mRFP) are displayed. Strain yRW9-1a. (D) Maximum radial distance ratio of cNPC along x and y axis. Strain yRW9-1a. (E) After the cells enter quiescence, the percentage of different nuclear geometries at incubation times in carbon-depleted medium. Strain yCNOD99-1a. (F) Percentage of elongated nuclei versus sphere-like nuclei in the dyn1Δ mutant after 48 h to 7 days of carbon depletion. Strain yRW19-1a. Results in E,F are represented as mean±s.e.m. (G) SPB probability density maps based on analysis of nuclei from dyn1Δ mutant cells after indicating time of starvation. Strain yRW20-1a. Scale bars: 1 μm.
Fig. 8.
Fig. 8.
Modification of the nuclear envelope after treatment with alpha factor. (A) DNA content in asynchronous culture after 2 h of alpha factor treatment and after alpha factor removal determined by flow cytometry. Strain yCNOD99-1a. (B) SPB probability density maps before and after treatment with alpha factor using the nucleolus as a secondary landmark. Representative fluorescent pictures (GFP–Nup49, SPC42–GFP and mCherry–Nop1) are displayed. Strain yRW11-1a. (C) Cumulative frequency of the SPB–central-axis angle. (D) Cumulative frequency of the distances from the SPB to the nucleolar centroid. (E) NPC probability density maps in an asynchronous population (left map), after 2 h of alpha factor blocking (right map) and 15 min after release in G1 (bottom map), using the nucleolus as a secondary landmark. Representative fluorescent pictures (GFP–Nup49 and mCherry–Nop1) are displayed. Strain yCNOD99-1a. Drawings depict the different nuclear shapes and the position and size of the nucleolus after 2 h treatment with alpha factor. (F) NPC probability density maps before and after treatment with alpha factor using the SPB as a secondary landmark. Representative fluorescent pictures (SPC42–GFP and Nup57–tDimerRFP) are displayed. Strain yRW10-1a. Drawings depict the percentage of different nuclear geometries after 2 h treatment with alpha factor. (G) Cumulative distribution of sphericity after 2 h of alpha factor blocking and 15 min after release in G1. Scale bars: 1 μm.

Similar articles

Cited by

References

    1. Alber F., Dokudovskaya S., Veenhoff L. M., Zhang W., Kipper J., Devos D., Suprapto A., Karni-Schmidt O., Williams R., Chait B. T. et al. (2007). Determining the architectures of macromolecular assemblies. Nature 450, 683-694. 10.1038/nature06404 - DOI - PubMed
    1. Albert B., Léger-Silvestre I., Normand C., Ostermaier M., Pérez-Fernández J., Panov K., Zomerdijk J. C. B. M., Schultz P. and Gadal O. (2011). RNA polymerase I–specific subunits promote polymerase clustering to enhance the rRNA gene transcription cycle. J. Cell Biol. 192, 277-293. 10.1083/jcb.201006040 - DOI - PMC - PubMed
    1. Albert B., Mathon J., Shukla A., Saad H., Normand C., Léger-Silvestre I., Villa D., Kamgoue A., Mozziconacci J., Wong H. et al. (2013). Systematic characterization of the conformation and dynamics of budding yeast chromosome XII. J. Cell Biol. 202, 201-210. 10.1083/jcb.201208186 - DOI - PMC - PubMed
    1. Berger A. B., Cabal G. G., Fabre E., Duong T., Buc H., Nehrbass U., Olivo-Marin J.-C., Gadal O. and Zimmer C. (2008). High-resolution statistical mapping reveals gene territories in live yeast. Nat. Methods 5, 1031-1037. 10.1038/nmeth.1266 - DOI - PubMed
    1. Boettcher B., Marquez-Lago T. T., Bayer M., Weiss E. L. and Barral Y. (2012). Nuclear envelope morphology constrains diffusion and promotes asymmetric protein segregation in closed mitosis. J. Cell Biol. 197, 921-937. 10.1083/jcb.201112117 - DOI - PMC - PubMed

Publication types

MeSH terms

LinkOut - more resources